MODFLOW-USG Freyberg demo
This example demonstrates a MODFLOW USG Freyberg model, including construction of an UnstructuredGrid from a specification file and plotting head data in cross-section.
First we locate the model directory.
[1]:
from pathlib import Path
[2]:
from pprint import pformat

import git
import pooch

import flopy

root_name = "freyberg.usg"

# Check if we are in the repository and define the data path.

try:
    root = Path(git.Repo(".", search_parent_directories=True).working_dir)
except:
    root = None

data_path = root / "examples" / "data" if root else Path.cwd()

file_names = {
    "freyberg.usg.bas": None,
    "freyberg.usg.disu": None,
    "freyberg.usg.ghb": None,
    "freyberg.usg.gnc": None,
    "freyberg.usg.gsf": None,
    "freyberg.usg.gsf.with_comment": None,
    "freyberg.usg.lpf": None,
    "freyberg.usg.nam": None,
    "freyberg.usg.oc": None,
    "freyberg.usg.rch": None,
    "freyberg.usg.sfr": None,
    "freyberg.usg.sms": None,
    "freyberg.usg.wel": None,
}
for fname, fhash in file_names.items():
    pooch.retrieve(
        url=f"https://github.com/modflowpy/flopy/raw/develop/examples/data/{root_name.replace('.', '_')}/{fname}",
        fname=fname,
        path=data_path / root_name.replace(".", "_"),
        known_hash=None,
    )


model_ws = data_path / root_name.replace(".", "_")
Now construct an UnstructuredGrid from a grid specification file.
[3]:
from flopy.discretization import UnstructuredGrid

mfgrid = UnstructuredGrid.from_gridspec(str(model_ws / f"{root_name}.gsf"))
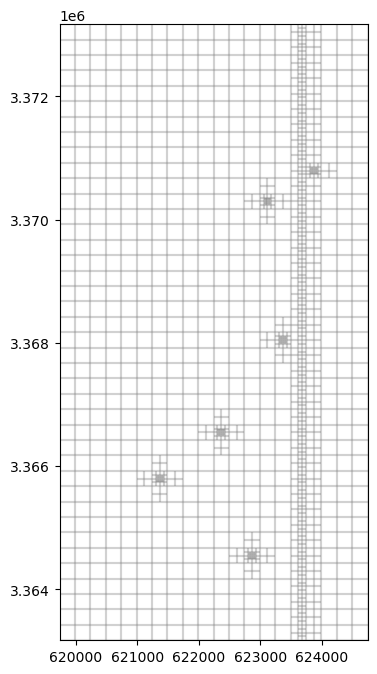
Plot the grid in map view.
[4]:
import matplotlib.pyplot as plt

fig = plt.figure(figsize=(8, 8))
ax = fig.add_subplot(1, 1, 1, aspect="equal")
pmv = flopy.plot.PlotMapView(modelgrid=mfgrid, ax=ax)
pmv.plot_grid(alpha=0.1)
[4]:
<matplotlib.collections.LineCollection at 0x7ffaf40e7620>
Create cross-section lines.
[5]:
from flopy.utils.geometry import LineString

lines = [
    LineString(ls)
    for ls in [
        [(623000, 3364000), (623000, 3372000)],
        [(623650, 3364000), (623650, 3372000)],
    ]
]
Load the model and retrieve inactive cells.
[6]:
gwf = flopy.mfusg.MfUsg.load(
    f"{root_name}.nam",
    model_ws=str(model_ws),
    verbose=False,
    check=False,
    exe_name="mfusg",
)

bas6 = gwf.get_package("bas6")
ibound = bas6.ibound.array
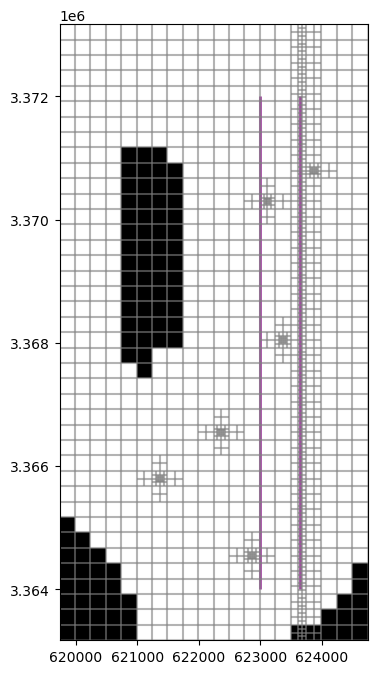
Show the map view again with cross-section lines and inactive cells.
[7]:
fig = plt.figure(figsize=(8, 8))
ax = fig.add_subplot(1, 1, 1, aspect="equal")
pmv = flopy.plot.PlotMapView(modelgrid=mfgrid, ax=ax)
grid = pmv.plot_grid(alpha=0.2)
shps = pmv.plot_shapes(lines, edgecolor="purple", lw=2, alpha=0.7)
inac = pmv.plot_inactive(ibound=ibound)
/home/runner/micromamba/envs/flopy/lib/python3.12/site-packages/geopandas/_compat.py:7: DeprecationWarning: The 'shapely.geos' module is deprecated, and will be removed in a future version. All attributes of 'shapely.geos' are available directly from the top-level 'shapely' namespace (since shapely 2.0.0).
  import shapely.geos
Next, we can run the model and plot cross-sections of the resulting head. We will run the model in a temporary workspace to avoid altering the example data.
[8]:
from tempfile import TemporaryDirectory

# temporary directory
temp_dir = TemporaryDirectory()
work_dir = Path(temp_dir.name) / "freyberg_usg"

gwf.change_model_ws(str(work_dir))
gwf.write_name_file()
gwf.write_input()
success, buff = gwf.run_model(silent=True, report=True)
assert success, pformat(buff)
creating model workspace...
   ../../../../../../../tmp/tmpa0n3_t1o/freyberg_usg
Load head data from the output files:
[9]:
import numpy as np

hds = flopy.utils.HeadUFile(str(work_dir / f"{root_name}.hds"), model=gwf)
times = hds.get_times()
head = np.array(hds.get_data())
print(head.shape)
(3, 1499)
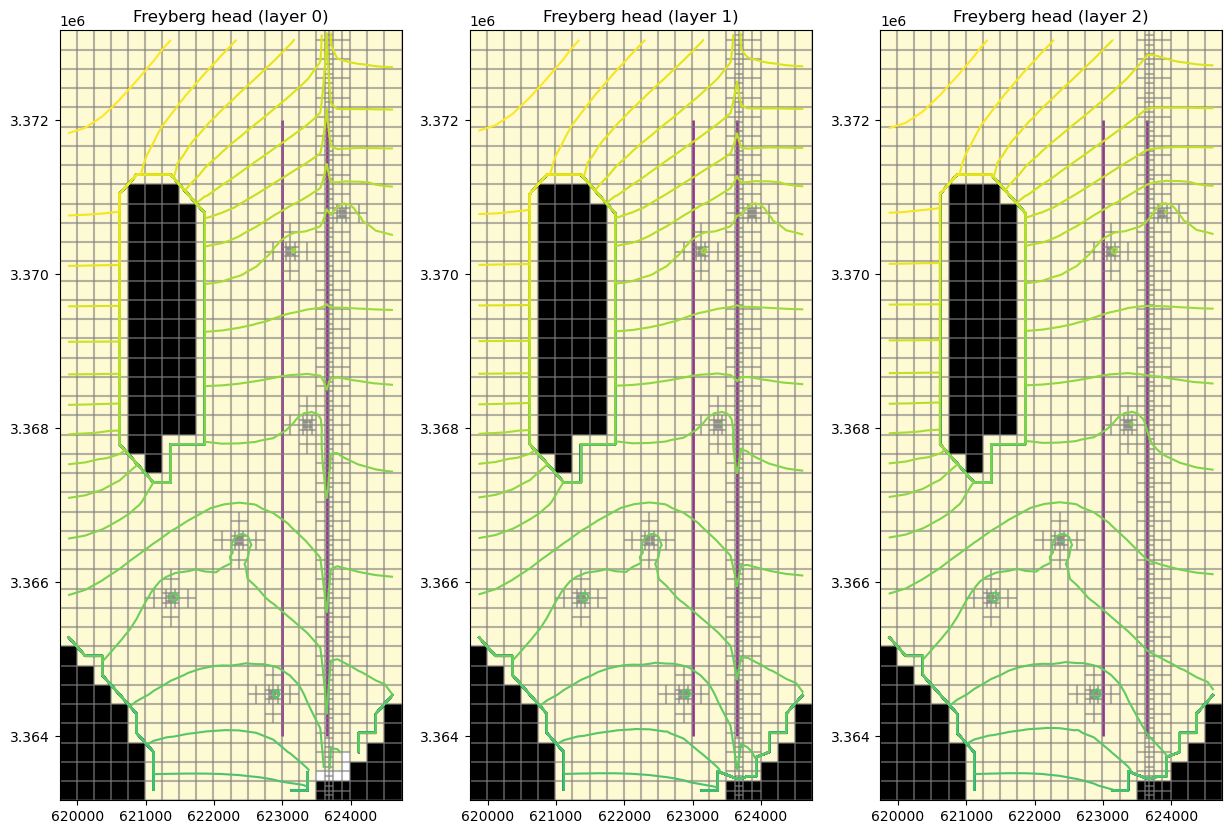
Plot the head colormap and contours for each layer.
[10]:
levels = np.arange(30, 35.4, 0.1)
fig = plt.figure(figsize=(15, 10))

for layer, h in enumerate(head):
    ax = fig.add_subplot(1, len(head), layer + 1)
    ax.set_title(f"Freyberg head (layer {layer})")
    pmv = flopy.plot.PlotMapView(modelgrid=mfgrid, ax=ax)
    mesh = pmv.plot_array(h, alpha=0.2)
    grid = pmv.plot_grid(alpha=0.2)
    shps = pmv.plot_shapes(lines, edgecolor="purple", lw=2, alpha=0.8)
    inac = pmv.plot_inactive(ibound=ibound)
    ctrs = pmv.contour_array(h, levels=levels)
A head argument can be provided to CrossSectionPlot.contour_array() to show the phreatic surface.
[11]:
fig = plt.figure(figsize=(25, 5))

for i, line in enumerate(lines):
    ax = fig.add_subplot(1, len(lines), i + 1)
    ax.set_title(f"Freyberg head cross-section (line {i})")
    xsect = flopy.plot.PlotCrossSection(
        modelgrid=mfgrid, ax=ax, line={"line": lines[i]}, geographic_coords=True
    )
    xsect.plot_array(head, head=head, alpha=0.4)
    xsect.plot_ibound(ibound=ibound, head=head)
    xsect.plot_inactive(ibound=ibound)
    contours = xsect.contour_array(
        head, masked_values=[999.0], head=head, levels=levels, alpha=1.0, colors="blue"
    )
    plt.clabel(contours, fmt="%.0f", colors="blue", fontsize=12)
    xsect.plot_grid(alpha=0.2)
    ax.set_ylim([0, 40])  # set y axis range to ignore low elevations
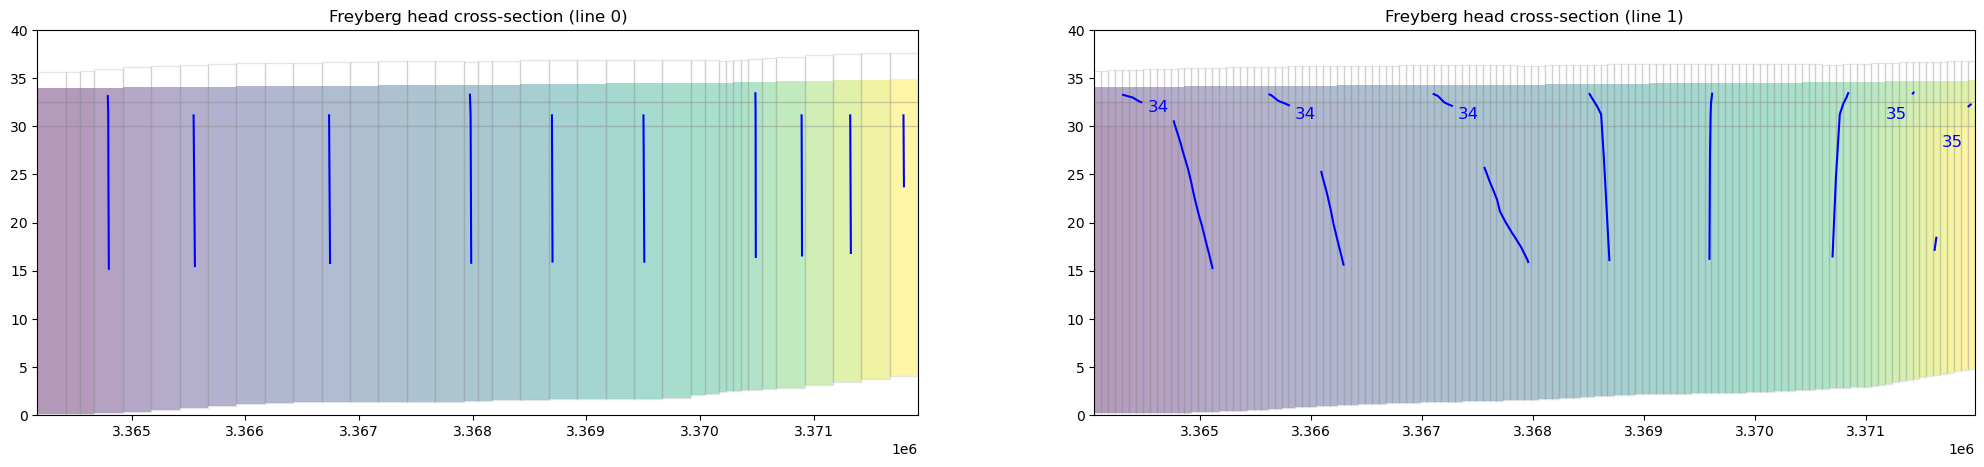
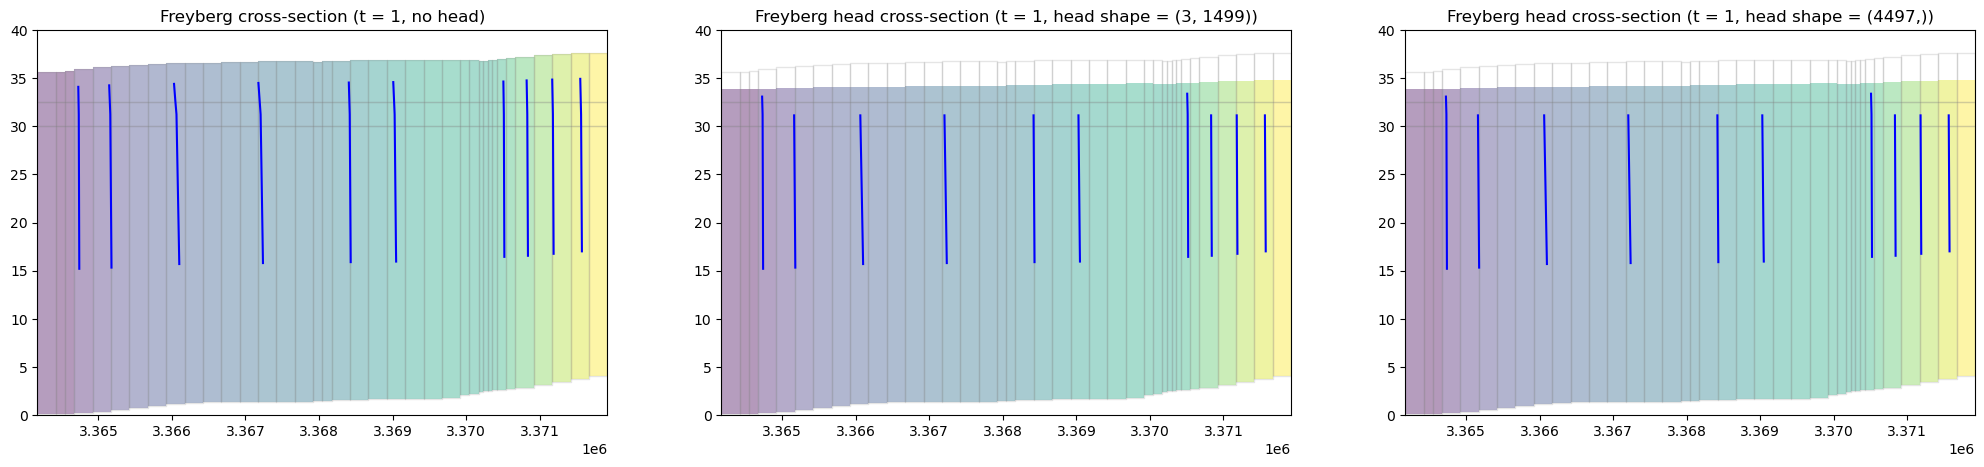
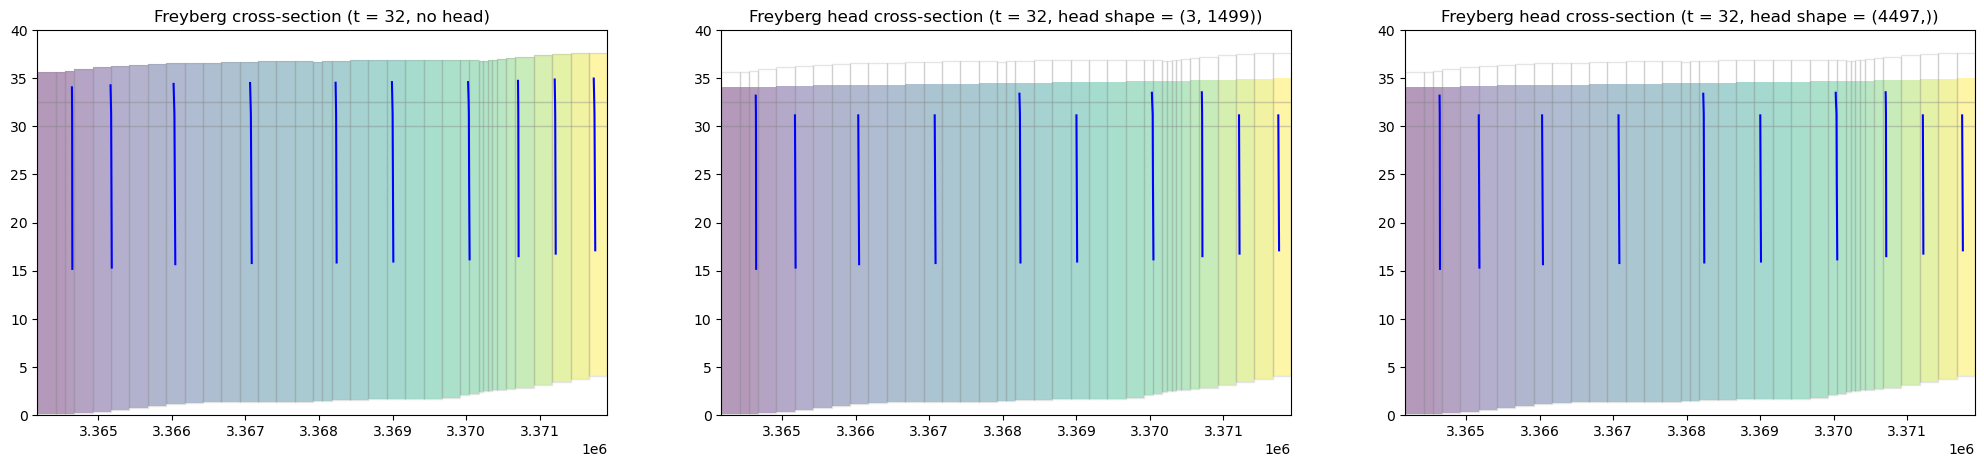
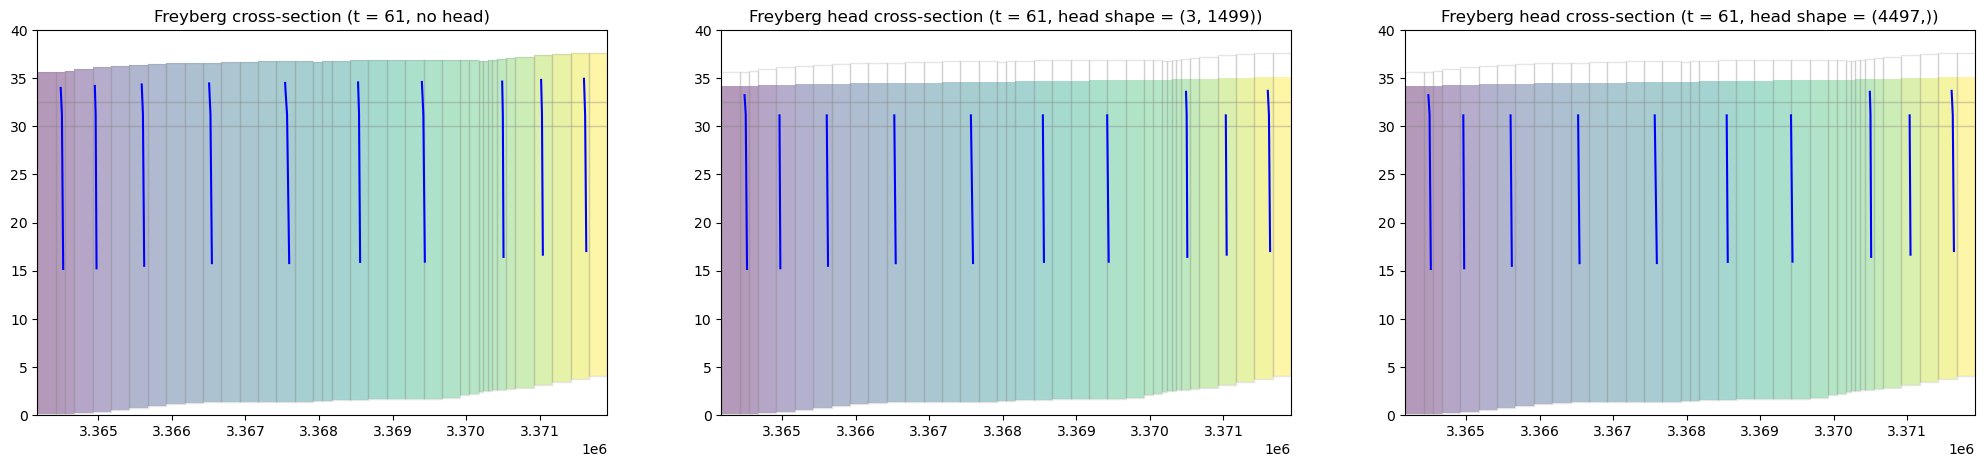
The head argument can be a 1D array or a 2D array matching the shape of the grid (i.e., head.shape == (layer count, ncpl)).
[12]:
line = lines[0]

for time in times[0:3]:
    head = np.array(hds.get_data(totim=time))
    head2 = np.hstack(head)

    fig = plt.figure(figsize=(25, 5))
    ax = fig.add_subplot(1, 3, 1)
    ax.set_title(f"Freyberg cross-section (t = {int(time)}, no head)")
    xsect = flopy.plot.PlotCrossSection(
        modelgrid=mfgrid, ax=ax, line={"line": line}, geographic_coords=True
    )
    cmap = xsect.plot_array(head2, masked_values=[-999.99], alpha=0.4)
    contours = xsect.contour_array(head2, levels=levels, alpha=1.0, colors="blue")
    xsect.plot_inactive(ibound=ibound, color_noflow=(0.8, 0.8, 0.8))
    xsect.plot_grid(alpha=0.2)
    ax.set_ylim([0, 40])  # set y axis range to ignore low elevations

    ax = fig.add_subplot(1, 3, 2)
    ax.set_title(
        f"Freyberg head cross-section (t = {int(time)}, head shape = {head.shape})"
    )
    xsect = flopy.plot.PlotCrossSection(
        modelgrid=mfgrid, ax=ax, line={"line": line}, geographic_coords=True
    )
    cmap = xsect.plot_array(head, masked_values=[-999.99], head=head, alpha=0.4)
    contours = xsect.contour_array(
        head, head=head, levels=levels, alpha=1.0, colors="blue"
    )
    xsect.plot_inactive(ibound=ibound, color_noflow=(0.8, 0.8, 0.8))
    xsect.plot_grid(alpha=0.2)
    ax.set_ylim([0, 40])

    ax = fig.add_subplot(1, 3, 3)
    ax.set_title(
        f"Freyberg head cross-section (t = {int(time)}, head shape = {head2.shape})"
    )
    xsect = flopy.plot.PlotCrossSection(
        modelgrid=mfgrid, ax=ax, line={"line": line}, geographic_coords=True
    )
    cmap = xsect.plot_array(head2, masked_values=[-999.99], head=head2, alpha=0.4)
    contours = xsect.contour_array(
        head2, head=head2, levels=levels, alpha=1.0, colors="blue"
    )
    xsect.plot_inactive(ibound=ibound, color_noflow=(0.8, 0.8, 0.8))
    xsect.plot_grid(alpha=0.2)
    ax.set_ylim([0, 40])
[13]:
try:
    # ignore PermissionError on Windows
    temp_dir.cleanup()
except:
    pass