This page was generated from
groundwater2023_watershed_example.py.
It's also available as a notebook.
Watershed geoprocessing example
From Hughes, Joseph D., Langevin, Christian D., Paulinski, Scott R., Larsen, Joshua D., and Brakenhoff, David, 2023, FloPy Workflows for Creating Structured and Unstructured MODFLOW Models: Groundwater, https://doi.org/10.1111/gwat.13327
[1]:
import os
import sys
from pathlib import Path
[2]:
import git
import matplotlib as mpl
import matplotlib.pyplot as plt
import numpy as np
import pooch
import shapely
import yaml
from matplotlib import gridspec
from shapely.geometry import LineString, Polygon
[3]:
import flopy
from flopy.discretization import StructuredGrid, VertexGrid
from flopy.plot import styles
from flopy.utils.gridgen import Gridgen
from flopy.utils.gridintersect import GridIntersect
from flopy.utils.triangle import Triangle
from flopy.utils.voronoi import VoronoiGrid
[4]:
print(sys.version)
print(f"numpy version: {np.__version__}")
print(f"matplotlib version: {mpl.__version__}")
print(f"flopy version: {flopy.__version__}")
3.10.18 | packaged by conda-forge | (main, Jun  4 2025, 14:45:41) [GCC 13.3.0]
numpy version: 2.2.6
matplotlib version: 3.10.6
flopy version: 3.11.0.dev0
[5]:
# define a few utility functions
def string2geom(geostring, conversion=None):
    if conversion is None:
        multiplier = 1.0
    else:
        multiplier = float(conversion)
    res = []
    for line in geostring.split("\n"):
        if not any(line):
            continue
        line = line.strip()
        line = line.split(" ")
        x = float(line[0]) * multiplier
        y = float(line[1]) * multiplier
        res.append((x, y))
    return res
[6]:
def densify_geometry(line, step, keep_internal_nodes=True):
    xy = []  # list of tuple of coordinates
    lines_strings = []
    if keep_internal_nodes:
        for idx in range(1, len(line)):
            lines_strings.append(shapely.geometry.LineString(line[idx - 1 : idx + 1]))
    else:
        lines_strings = [shapely.geometry.LineString(line)]

    for line_string in lines_strings:
        length_m = line_string.length  # get the length
        for distance in np.arange(0, length_m + step, step):
            point = line_string.interpolate(distance)
            xy_tuple = (point.x, point.y)
            if xy_tuple not in xy:
                xy.append(xy_tuple)
        # make sure the end point is in xy
        if keep_internal_nodes:
            xy_tuple = line_string.coords[-1]
            if xy_tuple not in xy:
                xy.append(xy_tuple)

    return xy
[7]:
# function to set the active and inactive model area
def set_idomain(grid, boundary):
    ix = GridIntersect(grid, rtree=True)
    result = ix.intersect(Polygon(boundary), geo_dataframe=False)
    idx = list(result.cellids)
    idx = np.array(idx, dtype=int)
    nr = idx.shape[0]
    if idx.ndim == 1:
        idx = idx.reshape((nr, 1))
    idx = tuple(idx[:, i] for i in range(idx.shape[1]))
    idomain = np.zeros(grid.shape[1:], dtype=int)
    idomain[idx] = 1
    idomain = idomain.reshape(grid.shape)
    grid.idomain = idomain
Check if we are in the repository and define the data path.
[8]:
try:
    root = Path(git.Repo(".", search_parent_directories=True).working_dir)
except:
    root = None
[9]:
data_path = root / "examples" / "data" if root else Path.cwd()
folder_name = "groundwater2023"
fname = "geometries.yml"
pooch.retrieve(
    url=f"https://github.com/modflowpy/flopy/raw/develop/examples/data/{folder_name}/{fname}",
    fname=fname,
    path=data_path / folder_name,
    known_hash=None,
)
[9]:
'/home/runner/work/flopy/flopy/flopy/examples/data/groundwater2023/geometries.yml'
[10]:
geometries = yaml.safe_load(open(data_path / folder_name / fname))
[11]:
# basic figure size
figwidth = 180  # 90 # mm
figwidth = figwidth / 10 / 2.54  # inches
figheight = figwidth
figsize = (figwidth, figheight)
[12]:
# figure settings
levels = np.arange(10, 110, 10)
contour_color = "black"
contour_style = "--"
contour_dict = {
    "levels": levels,
    "linewidths": 0.5,
    "colors": contour_color,
    "linestyles": contour_style,
}
clabel_dict = {
    "inline": True,
    "fmt": "%1.0f",
    "fontsize": 6,
    "inline_spacing": 0.5,
}
font_dict = {
    "fontsize": 5,
    "color": "black",
}
grid_dict = {
    "lw": 0.25,
    "color": "0.5",
}
refinement_dict = {
    "color": "magenta",
    "ls": ":",
    "lw": 1.0,
}
river_dict = {
    "color": "blue",
    "linestyle": "-",
    "linewidth": 1,
}
intersection_cmap = "Pastel2"
temp_cmap = mpl.colormaps[intersection_cmap]
intersection_rgba = temp_cmap(0)
[13]:
# make a temporary working directory for gridgen output
temp_path = "./temp"
if not os.path.isdir(temp_path):
    os.mkdir(temp_path)
[14]:
# Load the fine topography that will be sampled
fname = "fine_topo.asc"
ascii_file = pooch.retrieve(
    url=f"https://github.com/modflowpy/flopy/raw/develop/examples/data/geospatial/{fname}",
    fname=fname,
    path=data_path / "geospatial",
    known_hash=None,
)
fine_topo = flopy.utils.Raster.load(ascii_file)
Define the problem size and extents
[15]:
Lx = 180000
Ly = 100000
extent = (0, Lx, 0, Ly)
vmin, vmax = 0.0, 100.0
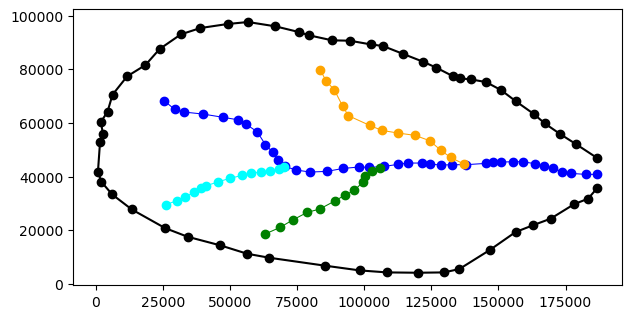
Create boundary and river data that will be used to refine the unstructured grids
[16]:
boundary_polygon = string2geom(geometries["boundary"])
bp = np.array(boundary_polygon)

sgs = [string2geom(geometries[f"streamseg{i}"]) for i in range(1, 5)]

fig = plt.figure(figsize=figsize)
ax = fig.add_subplot()
ax.set_aspect("equal")

riv_colors = ("blue", "cyan", "green", "orange", "red")

ax.plot(bp[:, 0], bp[:, 1], "ko-")
for idx, sg in enumerate(sgs):
    sa = np.array(sg)
    ax.plot(sa[:, 0], sa[:, 1], color=riv_colors[idx], lw=0.75, marker="o")
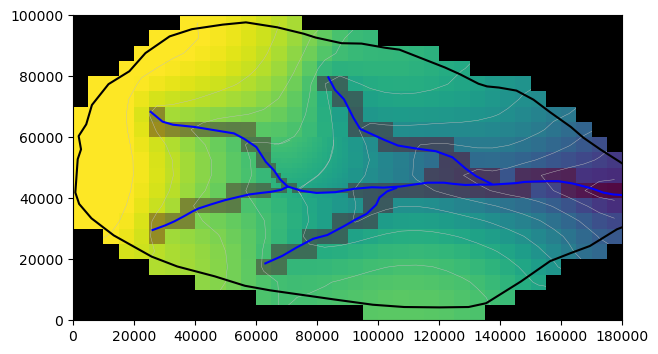
Structured Grids
Structured grid with constant row and column spacing
[17]:
dx = dy = 1666.66666667
nlay = 1
nrow = int(Ly / dy) + 1
ncol = int(Lx / dx) + 1
delr = np.array(ncol * [dx])
delc = np.array(nrow * [dy])
top = np.ones((nrow, ncol)) * 1000.0
botm = np.ones((nlay, nrow, ncol)) * -100.0
struct_grid = StructuredGrid(
    nlay=nlay, delr=delr, delc=delc, xoff=0.0, yoff=0.0, top=top, botm=botm
)

set_idomain(struct_grid, boundary_polygon)
[18]:
top_sg = fine_topo.resample_to_grid(
    struct_grid,
    band=fine_topo.bands[0],
    method="linear",
    extrapolate_edges=True,
)
[19]:
ixs = flopy.utils.GridIntersect(struct_grid)
cellids = []
for sg in sgs:
    v = ixs.intersect(LineString(sg), sort_by_cellid=True, geo_dataframe=False)
    cellids += v["cellids"].tolist()
intersection_sg = np.zeros(struct_grid.shape[1:])
for loc in cellids:
    intersection_sg[loc] = 1
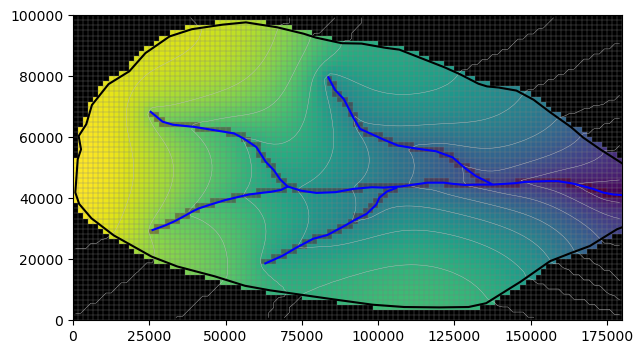
[20]:
fig = plt.figure(figsize=figsize)
ax = fig.add_subplot()
pmv = flopy.plot.PlotMapView(modelgrid=struct_grid)
ax.set_aspect("equal")
pmv.plot_array(top_sg)
pmv.plot_array(intersection_sg, masked_values=[0], alpha=0.2, cmap="Reds_r")
pmv.plot_grid(lw=0.25, color="0.5")
cg = pmv.contour_array(top_sg, levels=levels, linewidths=0.3, colors="0.75")
pmv.plot_inactive()

ax.plot(bp[:, 0], bp[:, 1], "k-")
for sg in sgs:
    sa = np.array(sg)
    ax.plot(sa[:, 0], sa[:, 1], "b-")
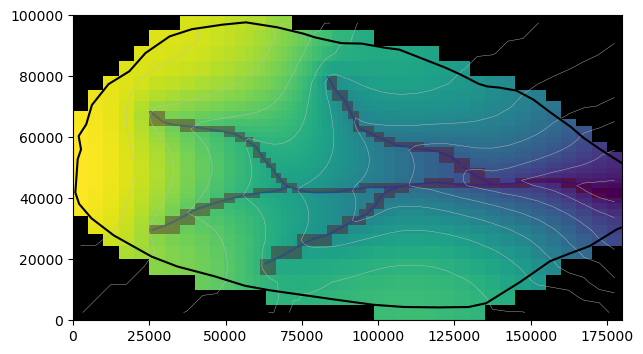
Structured grid with variable row and column spacing
[21]:
dx = dy = 5000

# create transition cells
multiplier = 1.175
transition = 20000.0
ncells = 7
smoothr = [transition * (multiplier - 1.0) / (multiplier ** float(ncells) - 1.0)]
for i in range(ncells - 1):
    smoothr.append(smoothr[i] * multiplier)
smooth = smoothr.copy()
smooth.reverse()
[22]:
# build the structured grid with variable row and column spacing
dx = 9 * [5000] + smooth + 15 * [1666.66666667] + smoothr + 14 * [5000]
dy = 4 * [5000] + smooth + 12 * [1666.66666667] + smoothr + 4 * [5000]

nlay = 1
ncol = len(dx)
nrow = len(dy)

top = np.ones((nrow, ncol)) * 1000.0
botm = np.ones((nlay, nrow, ncol)) * -100.0

delr = np.array(dx)
delc = np.array(dy)
struct_vrc_grid = StructuredGrid(
    nlay=nlay,
    delr=delr,
    delc=delc,
    xoff=0.0,
    yoff=0.0,
    top=top,
    botm=botm,
)
set_idomain(struct_vrc_grid, boundary_polygon)
[23]:
top_sg_vrc = fine_topo.resample_to_grid(
    struct_vrc_grid,
    band=fine_topo.bands[0],
    method="linear",
    extrapolate_edges=True,
)
[24]:
ixs = flopy.utils.GridIntersect(struct_vrc_grid)
cellids = []
for sg in sgs:
    v = ixs.intersect(LineString(sg), sort_by_cellid=True, geo_dataframe=False)
    cellids += v["cellids"].tolist()
intersection_sg_vrc = np.zeros(struct_vrc_grid.shape[1:])
for loc in cellids:
    intersection_sg_vrc[loc] = 1
[25]:
fig = plt.figure(figsize=figsize)
ax = fig.add_subplot()
pmv = flopy.plot.PlotMapView(modelgrid=struct_vrc_grid)
ax.set_aspect("equal")
pmv.plot_array(top_sg_vrc)
pmv.plot_array(intersection_sg_vrc, masked_values=[0], alpha=0.2, cmap="Reds_r")
cg = pmv.contour_array(top_sg_vrc, levels=levels, linewidths=0.3, colors="0.75")
pmv.plot_inactive()

ax.plot(bp[:, 0], bp[:, 1], "k-")
for sg in sgs:
    sa = np.array(sg)
    ax.plot(sa[:, 0], sa[:, 1], "b-", alpha=0.2)
Local grid refinement grid
[26]:
from flopy.utils.lgrutil import Lgr

nlayp = 1
dx = 5000
nrowp = int(Ly / dx)
ncolp = int(Lx / dx)
delrp = dx
delcp = dx
# topp = 1000.0
# botmp = [-100.]
topp = np.ones((nrowp, ncolp)) * 1000.0
botmp = np.ones((nlayp, nrowp, ncolp)) * -100.0

idomainp = np.ones((nlayp, nrowp, ncolp), dtype=int)
idomainp[0, 8:12, 13:18] = 0

ncpp = 3
ncppl = [1]

lgr = Lgr(
    nlayp,
    nrowp,
    ncolp,
    delrp,
    delcp,
    topp,
    botmp,
    idomainp,
    ncpp=ncpp,
    ncppl=ncppl,
    xllp=0.0,
    yllp=0.0,
)

delr = np.array(ncolp * [dx])
delc = np.array(nrowp * [dx])
struct_gridp = StructuredGrid(
    nlay=1, delr=delr, delc=delc, idomain=idomainp, top=topp, botm=botmp
)
set_idomain(struct_gridp, boundary_polygon)

delr_child, delc_child = lgr.get_delr_delc()
xoff, yoff = lgr.get_lower_left()
nrowc, ncolc = delc_child.shape[0], delr_child.shape[0]
topc = np.ones((nrowc, ncolc)) * 1000.0
botmc = np.ones((nlayp, nrowc, ncolc)) * -100.0
struct_gridc = StructuredGrid(
    delr=delr_child,
    delc=delc_child,
    xoff=xoff,
    yoff=yoff,
    idomain=idomainp,
    top=topc,
    botm=botmc,
)

extent_child = struct_gridc.extent

nested_grid = [struct_gridp, struct_gridc]
[27]:
top_ngp = fine_topo.resample_to_grid(
    struct_gridp,
    band=fine_topo.bands[0],
    method="linear",
    extrapolate_edges=True,
)
top_ngc = fine_topo.resample_to_grid(
    struct_gridc,
    band=fine_topo.bands[0],
    method="linear",
    extrapolate_edges=True,
)
top_nested_grid = [top_ngp, top_ngc]
[28]:
ixs = flopy.utils.GridIntersect(struct_gridp)
cellids = []
for sg in sgs:
    v = ixs.intersect(LineString(sg), sort_by_cellid=True, geo_dataframe=False)
    cellids += v["cellids"].tolist()
intersection_ngp = np.zeros(struct_gridp.shape[1:])
for loc in cellids:
    intersection_ngp[loc] = 1
intersection_ngp[idomainp[0] == 0] = 0

ixs = flopy.utils.GridIntersect(struct_gridc)
cellids = []
for sg in sgs:
    v = ixs.intersect(LineString(sg), sort_by_cellid=True, geo_dataframe=False)
    cellids += v["cellids"].tolist()
intersection_ngc = np.zeros(struct_gridc.shape[1:])
for loc in cellids:
    intersection_ngc[loc] = 1

intersection_nested_grid = [intersection_ngp, intersection_ngc]
[29]:
fig = plt.figure(figsize=figsize)
ax = fig.add_subplot()
pmv = flopy.plot.PlotMapView(modelgrid=struct_gridp, extent=extent)
pmv.plot_inactive()
pmv.plot_array(top_ngp, vmin=vmin, vmax=vmax)
pmv.plot_array(intersection_nested_grid[0], masked_values=[0], alpha=0.2, cmap="Reds_r")
cgp = pmv.contour_array(top_ngp, levels=levels, linewidths=0.3, colors="0.75")
pmv.plot_inactive(zorder=100)
ax.set_aspect("equal")

pmvc = flopy.plot.PlotMapView(modelgrid=struct_gridc, ax=ax, extent=extent)
# pmvc.plot_grid()
pmvc.plot_array(top_ngc, vmin=vmin, vmax=vmax)
pmvc.plot_array(
    intersection_nested_grid[1], masked_values=[0], alpha=0.2, cmap="Reds_r"
)
cgc = pmvc.contour_array(top_ngc, levels=levels, linewidths=0.3, colors="0.75")

ax.plot(bp[:, 0], bp[:, 1], "k-")
for sg in sgs:
    sa = np.array(sg)
    ax.plot(sa[:, 0], sa[:, 1], "b-")
Unstructured grids
[30]:
# create a polygon of the common refinement area for the quadtree grid
lgr_poly = [
    [
        (extent_child[0], extent_child[2]),
        (extent_child[0], extent_child[3]),
        (extent_child[1], extent_child[3]),
        (extent_child[1], extent_child[2]),
        (extent_child[0], extent_child[2]),
    ]
]
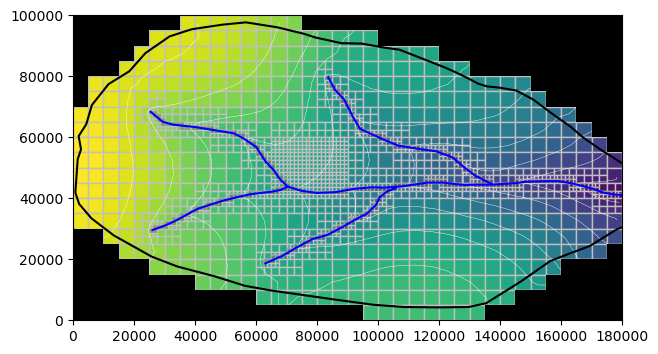
Quadtree grid
[31]:
sim = flopy.mf6.MFSimulation()
gwf = flopy.mf6.ModflowGwf(sim)
dx = dy = 5000.0
nr = int(Ly / dy)
nc = int(Lx / dx)
dis6 = flopy.mf6.ModflowGwfdis(
    gwf,
    nrow=nr,
    ncol=nc,
    delr=dy,
    delc=dx,
)
g = Gridgen(gwf.modelgrid, model_ws=temp_path)
adpoly = [[[(1000, 1000), (3000, 1000), (3000, 2000), (1000, 2000), (1000, 1000)]]]
adpoly = boundary_polygon + [boundary_polygon[0]]
adpoly = [[adpoly]]
g.add_refinement_features([lgr_poly], "polygon", 2, range(1))

refine_line = sgs
g.add_refinement_features(refine_line, "line", 2, range(1))
g.build(verbose=False)

gridprops_vg = g.get_gridprops_vertexgrid()
quadtree_grid = flopy.discretization.VertexGrid(**gridprops_vg)
set_idomain(quadtree_grid, boundary_polygon)
/home/runner/work/flopy/flopy/modflow6/.pixi/envs/rtd/lib/python3.10/site-packages/pyogrio/__init__.py:7: DeprecationWarning: The 'shapely.geos' module is deprecated, and will be removed in a future version. All attributes of 'shapely.geos' are available directly from the top-level 'shapely' namespace (since shapely 2.0.0).
  import shapely.geos  # noqa: F401
[32]:
top_qg = fine_topo.resample_to_grid(
    quadtree_grid,
    band=fine_topo.bands[0],
    method="linear",
    extrapolate_edges=True,
)
[33]:
ixs = flopy.utils.GridIntersect(quadtree_grid)
cellids = []
for sg in sgs:
    v = ixs.intersect(LineString(sg), sort_by_cellid=True, geo_dataframe=False)
    cellids += v["cellids"].tolist()
intersection_qg = np.zeros(quadtree_grid.shape[1:])
for loc in cellids:
    intersection_qg[loc] = 1
[34]:
fig = plt.figure(figsize=figsize)
ax = fig.add_subplot()
pmv = flopy.plot.PlotMapView(modelgrid=quadtree_grid)
pmv.plot_array(top_qg, ec="0.75")
pmv.plot_array(intersection_qg, masked_values=[0], alpha=0.2, cmap="Reds_r")
cg = pmv.contour_array(top_qg, levels=levels, linewidths=0.3, colors="white")
pmv.plot_inactive(zorder=100)
ax.set_aspect("equal")

ax.plot(bp[:, 0], bp[:, 1], "k-")
for sg in sgs:
    sa = np.array(sg)
    ax.plot(sa[:, 0], sa[:, 1], "b-")
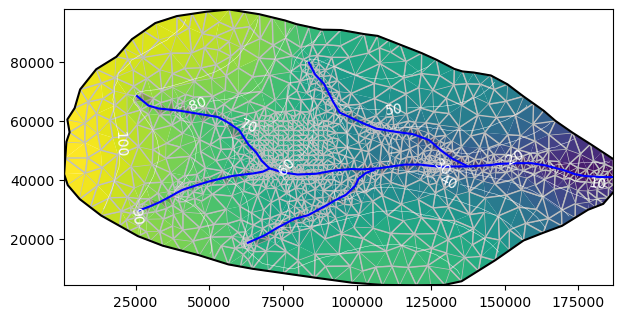
Triangular grid
[35]:
nodes = []
for sg in sgs:
    sg_densify = densify_geometry(sg, 2000)
    nodes.extend(sg_densify)
for x in struct_gridc.get_xvertices_for_layer(0)[0, :]:
    for y in struct_gridc.get_yvertices_for_layer(0)[:, 0]:
        nodes.append((x, y))
nodes = np.array(nodes)
[36]:
tri = Triangle(maximum_area=5000 * 5000, angle=30, nodes=nodes, model_ws=temp_path)
poly = bp
tri.add_polygon(poly)
tri.build(verbose=False)


cell2d = tri.get_cell2d()
vertices = tri.get_vertices()

top = np.ones(tri.ncpl) * 1000.0
botm = np.ones((1, tri.ncpl)) * -100.0
idomain = np.ones((1, tri.ncpl), dtype=int)

triangular_grid = VertexGrid(
    vertices=vertices,
    cell2d=cell2d,
    idomain=idomain,
    nlay=1,
    ncpl=tri.ncpl,
    top=top,
    botm=botm,
)
[37]:
top_tg = fine_topo.resample_to_grid(
    triangular_grid,
    band=fine_topo.bands[0],
    method="linear",
    extrapolate_edges=True,
)
[38]:
ixs = flopy.utils.GridIntersect(triangular_grid)
cellids = []
for sg in sgs:
    v = ixs.intersect(
        LineString(sg),
        return_all_intersections=True,
        sort_by_cellid=True,
        geo_dataframe=False,
    )
    cellids += v["cellids"].tolist()
intersection_tg = np.zeros(triangular_grid.shape[1:])
for loc in cellids:
    intersection_tg[loc] = 1
[39]:
fig = plt.figure(figsize=figsize)
ax = fig.add_subplot()
ax.set_aspect("equal")

pmv = flopy.plot.PlotMapView(modelgrid=triangular_grid)

pmv.plot_array(top_tg, ec="0.75")
pmv.plot_array(intersection_tg, masked_values=[0], alpha=0.2, cmap="Reds_r")
cg = pmv.contour_array(top_tg, levels=levels, linewidths=0.3, colors="white")
ax.clabel(cg, cg.levels, inline=True, fmt="%1.0f", fontsize=10)

pmv.plot_inactive(zorder=100)

if True:
    ax.plot(bp[:, 0], bp[:, 1], "k-")
    for sg in sgs:
        sa = np.array(sg)
        ax.plot(sa[:, 0], sa[:, 1], "b-")
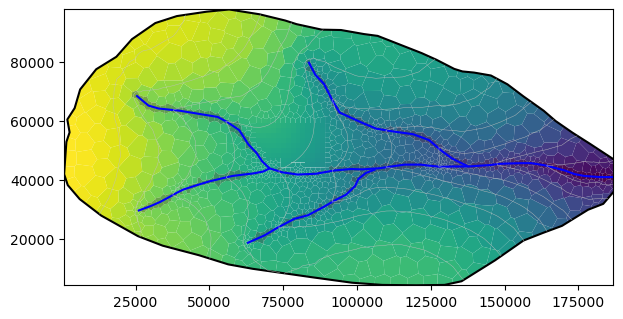
Voronoi Grid from the Triangle object
[40]:
# create vor object and VertexGrid from the triangle object tri
vor = VoronoiGrid(tri)
gridprops = vor.get_gridprops_vertexgrid()
idomain = np.ones((1, vor.ncpl), dtype=int)
voronoi_grid = VertexGrid(**gridprops, nlay=1, idomain=idomain)
[41]:
top_vg = fine_topo.resample_to_grid(
    voronoi_grid,
    band=fine_topo.bands[0],
    method="linear",
    extrapolate_edges=True,
)
[42]:
ixs = flopy.utils.GridIntersect(voronoi_grid)
cellids = []
for sg in sgs:
    v = ixs.intersect(
        LineString(sg),
        return_all_intersections=True,
        sort_by_cellid=True,
        geo_dataframe=False,
    )
    cellids += v["cellids"].tolist()
intersection_vg = np.zeros(voronoi_grid.shape[1:])
for loc in cellids:
    intersection_vg[loc] = 1
[43]:
fig = plt.figure(figsize=figsize)
ax = fig.add_subplot()
pmv = flopy.plot.PlotMapView(modelgrid=voronoi_grid)
ax.set_aspect("equal")
pmv.plot_array(top_vg)
pmv.plot_array(intersection_vg, masked_values=[0], alpha=0.2, cmap="Reds_r")
pmv.plot_inactive()
ax.plot(bp[:, 0], bp[:, 1], "k-")
for sg in sgs:
    sa = np.array(sg)
    ax.plot(sa[:, 0], sa[:, 1], "b-")

cg = pmv.contour_array(top_vg, levels=levels, linewidths=0.3, colors="0.75")
Plot all six grids
Create a polyline for Local Grid Refinement area
[44]:
lgr_poly_array = np.array(lgr_poly).squeeze()
Plot the grids
[45]:
# Make a plot of the six grids
figwidth = 17.15 / 2.54
figheight = 3.66 * (Ly / Lx) * 8.25 / 2.54
grids = [
    struct_grid,
    struct_vrc_grid,
    nested_grid,
    quadtree_grid,
    triangular_grid,
    voronoi_grid,
    None,
]
topo_grids = [top_sg, top_sg_vrc, top_nested_grid, top_qg, top_tg, top_vg]
extent = (0, 180000, 0, 100000)
cbar_axis = [0.0, 0.1, 0.25, 0.9]

with styles.USGSMap():
    fig = plt.figure(figsize=(figwidth, figheight), constrained_layout=True)
    gs = gridspec.GridSpec(ncols=16, nrows=17, figure=fig)
    axs = [fig.add_subplot(gs[:5, :8])]
    axs.append(fig.add_subplot(gs[:5, 8:]))
    axs.append(fig.add_subplot(gs[5:10, :8]))
    axs.append(fig.add_subplot(gs[5:10, 8:]))
    axs.append(fig.add_subplot(gs[10:15, :8]))
    axs.append(fig.add_subplot(gs[10:15, 8:]))
    axs.append(fig.add_subplot(gs[15:, :]))

    for idx, ax in enumerate(axs[:-1]):
        g = grids[idx]
        t = topo_grids[idx]
        if g is not None:
            if isinstance(g, list):
                g = g[0]
                t = t[0]

            pmv = flopy.plot.PlotMapView(modelgrid=g, ax=ax)

            v = pmv.plot_array(t)
            pmv.plot_grid(**grid_dict)
            cg = pmv.contour_array(t, **contour_dict)
            pmv.ax.clabel(cg, cg.levels, **clabel_dict)
            pmv.plot_inactive(color_noflow="gray", zorder=100)

            if isinstance(grids[idx], list):
                gg = grids[idx]
                tt = topo_grids[idx]
                for g, t in zip(gg[1:], tt[1:]):
                    pmvc = flopy.plot.PlotMapView(modelgrid=g, ax=ax, extent=extent)
                    pmvc.plot_array(top_ngc, vmin=vmin, vmax=vmax)
                    pmvc.plot_grid(**grid_dict)
                    cgc = pmvc.contour_array(top_ngc, **contour_dict)

            # plot lgr polyline
            ax.plot(
                lgr_poly_array[:, 0],
                lgr_poly_array[:, 1],
                zorder=101,
                **refinement_dict,
            )

            ax.set_aspect("equal")
            ax.set_axisbelow(False)

            ax.set_xlim(extent[0], extent[1])
            ax.set_xticks(np.arange(0, 200000, 50000))
            if idx in {4, 5}:
                ax.set_xticklabels(np.arange(0, 200, 50))
                ax.set_xlabel("x position (km)")
            else:
                ax.set_xticklabels([])

            ax.set_ylim(extent[2], extent[3])
            ax.set_yticks(np.arange(0, 150000, 50000))
            if idx in {0, 2, 4}:
                ax.set_yticklabels(np.arange(0, 150, 50))
                ax.set_ylabel("y position (km)")
            else:
                ax.set_yticklabels([])

            styles.heading(ax, idx=idx)
            if True:
                ax.plot(bp[:, 0], bp[:, 1], "k-", lw=2.0)
                for sg in sgs:
                    sa = np.array(sg)
                    ax.plot(sa[:, 0], sa[:, 1], **river_dict)

    # legend
    ax = axs[-1]
    xy0 = (-100, -100)
    ax.set_xlim(0, 1)
    ax.set_ylim(0, 1)
    ax.set_axis_off()

    ax.axhline(xy0[0], color="black", lw=2, label="Basin boundary")
    ax.axhline(xy0[0], **river_dict, label="River")
    ax.axhline(xy0[0], color=contour_color, lw=0.5, ls="--", label="Elevation contour")
    ax.axhline(xy0[0], label="Grid refinement area", **refinement_dict)
    ax.axhline(
        xy0[0],
        marker="s",
        mec="0.5",
        mfc="white",
        markeredgewidth=0.25,
        lw=0,
        label="Grid cell",
    )
    ax.axhline(
        xy0[0],
        marker="s",
        mec="0.5",
        mfc="gray",
        markeredgewidth=0.25,
        lw=0,
        label="Inactive area",
    )
    styles.graph_legend(
        ax,
        ncol=3,
        loc="lower center",
        labelspacing=0.5,
        columnspacing=0.6,
        handletextpad=0.3,
    )

    # colorbar
    ax = fig.add_subplot(gs[15:, 14:])
    ax.set_xlim(0, 1)
    ax.set_ylim(0, 1)
    ax.set_axis_off()
    cax = ax.inset_axes(cbar_axis)
    #     cax.set_axisbelow(False)
    cbar = plt.colorbar(v, orientation="vertical", cax=cax, ticks=[25, 50, 75, 100])
    cbar.ax.tick_params(labelsize=5, labelcolor="black", color="black", length=9, pad=2)
    cbar.ax.set_title("Elevation (m)", pad=2.5, loc="center", fontdict=font_dict)

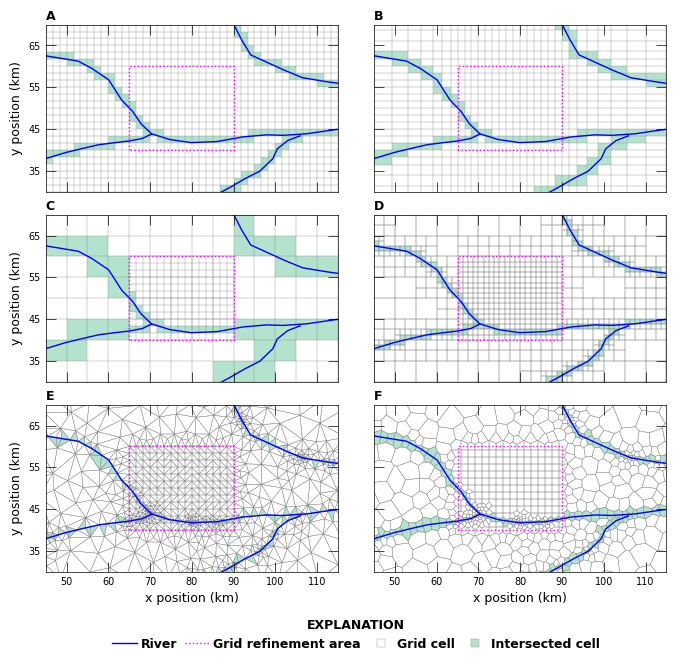
Plot the river intersection for the six grids
[46]:
figwidth = 17.15 / 2.54
figheight = 3.66 * (Ly / Lx) * 8.25 / 2.54
grids = [
    struct_grid,
    struct_vrc_grid,
    nested_grid,
    quadtree_grid,
    triangular_grid,
    voronoi_grid,
    None,
]
intersections = [
    intersection_sg,
    intersection_sg_vrc,
    intersection_nested_grid,
    intersection_qg,
    intersection_tg,
    intersection_vg,
    None,
]
extent = list(extent_child)
de = 10000.0
extent[0] -= 2.0 * de
extent[1] += 2.5 * de
extent[2] -= de
extent[3] += de


with styles.USGSMap():
    fig = plt.figure(figsize=(figwidth, figheight), constrained_layout=True)
    gs = gridspec.GridSpec(ncols=2, nrows=16, figure=fig)
    axs = [fig.add_subplot(gs[:5, 0])]
    axs.append(fig.add_subplot(gs[:5, 1]))
    axs.append(fig.add_subplot(gs[5:10, 0]))
    axs.append(fig.add_subplot(gs[5:10, 1]))
    axs.append(fig.add_subplot(gs[10:15, 0]))
    axs.append(fig.add_subplot(gs[10:15, 1]))
    axs.append(fig.add_subplot(gs[15:, :]))

    for idx, ax in enumerate(axs[:-1]):
        g = grids[idx]
        t = intersections[idx]
        if g is not None:
            if isinstance(g, list):
                g = g[0]
                t = t[0]

            pmv = flopy.plot.PlotMapView(modelgrid=g, ax=ax, extent=extent)

            v = pmv.plot_array(t, masked_values=(0,), cmap=intersection_cmap)
            pmv.plot_grid(**grid_dict)

            pmv.plot_inactive(color_noflow="gray", zorder=100)

            if isinstance(grids[idx], list):
                gg = grids[idx]
                tt = intersections[idx]
                for g, t in zip(gg[1:], tt[1:]):
                    pmvc = flopy.plot.PlotMapView(modelgrid=g, ax=ax, extent=extent)
                    pmvc.plot_array(t, masked_values=(0,), cmap=intersection_cmap)
                    pmvc.plot_grid(**grid_dict)

            # plot lgr polyline
            ax.plot(
                lgr_poly_array[:, 0],
                lgr_poly_array[:, 1],
                zorder=101,
                **refinement_dict,
            )

            ax.set_aspect("equal")
            ax.set_axisbelow(False)

            ax.set_xlim(extent[0], extent[1])
            ax.set_xticks(np.arange(50000, 120000, 10000))
            if idx in {4, 5}:
                ax.set_xticklabels(np.arange(50, 120, 10))
                ax.set_xlabel("x position (km)")
            else:
                ax.set_xticklabels([])

            ax.set_ylim(extent[2], extent[3])
            ax.set_yticks(np.arange(35000, 70000, 10000))
            if idx in {0, 2, 4}:
                ax.set_yticklabels(np.arange(35, 75, 10))
                ax.set_ylabel("y position (km)")
            else:
                ax.set_yticklabels([])

            styles.heading(ax, idx=idx)
            if True:
                ax.plot(bp[:, 0], bp[:, 1], "k-", lw=2.0)
                for sg in sgs:
                    sa = np.array(sg)
                    ax.plot(sa[:, 0], sa[:, 1], **river_dict)

    # legend
    ax = axs[-1]
    xy0 = (-100, -100)
    ax.set_xlim(0, 1)
    ax.set_ylim(0, 1)
    ax.set_axis_off()

    ax.axhline(xy0[0], **river_dict, label="River")
    ax.axhline(xy0[0], label="Grid refinement area", **refinement_dict)
    ax.axhline(
        xy0[0],
        marker="s",
        mec="0.5",
        mfc="white",
        markeredgewidth=0.25,
        lw=0,
        label="Grid cell",
    )
    ax.axhline(
        xy0[0],
        marker="s",
        mfc=intersection_rgba,
        mec="0.5",
        markeredgewidth=0.25,
        lw=0,
        label="Intersected cell",
    )
    styles.graph_legend(
        ax,
        ncol=4,
        loc="lower center",
        labelspacing=0.5,
        columnspacing=0.6,
        handletextpad=0.3,
    )