Shapefile export demo
The goal of this notebook is to demonstrate ways to export model information to shapefiles. This example will cover:
basic exporting of information for a model, individual package, or dataset
custom exporting of combined data from different packages
general exporting and importing of geographic data from other sources
[1]:
import os
import sys
[2]:
from pathlib import Path
from tempfile import TemporaryDirectory

import geopandas as gpd
import git
import matplotlib as mpl
import matplotlib.pyplot as plt
import numpy as np
import pandas as pd
import pooch

import flopy

print(sys.version)
print(f"numpy version: {np.__version__}")
print(f"matplotlib version: {mpl.__version__}")
print(f"flopy version: {flopy.__version__}")
3.10.18 | packaged by conda-forge | (main, Jun  4 2025, 14:45:41) [GCC 13.3.0]
numpy version: 2.2.6
matplotlib version: 3.10.6
flopy version: 3.11.0.dev0
[3]:
# temporary directory
temp_dir = TemporaryDirectory()
outdir = Path(temp_dir.name) / "shapefile_export"
outdir.mkdir(exist_ok=True)

# Check if we are in the repository and define the data path.

try:
    root = Path(git.Repo(".", search_parent_directories=True).working_dir)
except:
    root = None

data_path = root / "examples" / "data" if root else Path.cwd()

sim_name = "freyberg"

file_names = {
    "freyberg.bas": "63266024019fef07306b8b639c6c67d5e4b22f73e42dcaa9db18b5e0f692c097",
    "freyberg.dis": "62d0163bf36c7ee9f7ee3683263e08a0abcdedf267beedce6dd181600380b0a2",
    "freyberg.githds": "abe92497b55e6f6c73306e81399209e1cada34cf794a7867d776cfd18303673b",
    "freyberg.gitlist": "aef02c664344a288264d5f21e08a748150e43bb721a16b0e3f423e6e3e293056",
    "freyberg.lpf": "06500bff979424f58e5e4fbd07a7bdeb0c78f31bd08640196044b6ccefa7a1fe",
    "freyberg.nam": "e66321007bb603ef55ed2ba41f4035ba6891da704a4cbd3967f0c66ef1532c8f",
    "freyberg.oc": "532905839ccbfce01184980c230b6305812610b537520bf5a4abbcd3bd703ef4",
    "freyberg.pcg": "0d1686fac4680219fffdb56909296c5031029974171e25d4304e70fa96ebfc38",
    "freyberg.rch": "37a1e113a7ec16b61417d1fa9710dd111a595de738a367bd34fd4a359c480906",
    "freyberg.riv": "7492a1d5eb23d6812ec7c8227d0ad4d1e1b35631a765c71182b71e3bd6a6d31d",
    "freyberg.wel": "00aa55f59797c02f0be5318a523b36b168fc6651f238f34e8b0938c04292d3e7",
}
for fname, fhash in file_names.items():
    pooch.retrieve(
        url=f"https://github.com/modflowpy/flopy/raw/develop/examples/data/{sim_name}/{fname}",
        fname=fname,
        path=data_path / sim_name,
        known_hash=fhash,
    )

# load an existing model
model_ws = data_path / sim_name
m = flopy.modflow.Modflow.load(
    "freyberg.nam",
    model_ws=model_ws,
    verbose=False,
    check=False,
    exe_name="mfnwt",
)
[4]:
m.get_package_list()
[4]:
['DIS', 'BAS6', 'LPF', 'WEL', 'RIV', 'RCH', 'OC', 'PCG']
set the model coordinate information
the coordinate information where the grid is located in a projected coordinate system (e.g. UTM)
[5]:
grid = m.modelgrid
grid.set_coord_info(xoff=273170, yoff=5088657, crs=26916)
[6]:
grid.extent
[6]:
(np.float64(273170.0),
 np.float64(278170.0),
 np.float64(5088657.0),
 np.float64(5098657.0))
Declarative export using .to_geodataframe() method
Export the whole model to a single shapefile
[7]:
fname = f"{outdir}/model.shp"
gdf = m.to_geodataframe(shorten_attr=True)
gdf.to_file(fname)
/home/runner/work/flopy/flopy/modflow6/.pixi/envs/rtd/lib/python3.10/site-packages/pyogrio/__init__.py:7: DeprecationWarning: The 'shapely.geos' module is deprecated, and will be removed in a future version. All attributes of 'shapely.geos' are available directly from the top-level 'shapely' namespace (since shapely 2.0.0).
  import shapely.geos  # noqa: F401
[8]:
ax = plt.subplot(1, 1, 1, aspect="equal")
extents = grid.extent
pc = flopy.plot.plot_shapefile(fname, ax=ax, edgecolor="k", facecolor="none")
ax.set_xlim(extents[0], extents[1])
ax.set_ylim(extents[2], extents[3])
ax.set_title(fname)
[8]:
Text(0.5, 1.0, '/tmp/tmpww0yjrvu/shapefile_export/model.shp')

[9]:
fname = f"{outdir}/wel.shp"
gdf = m.wel.to_geodataframe()
gdf.to_file(fname)
/tmp/ipykernel_10398/2997308663.py:3: UserWarning: Column names longer than 10 characters will be truncated when saved to ESRI Shapefile.
  gdf.to_file(fname)
Export a package to a shapefile
Export a FloPy list or array object
[10]:
m.lpf.hk
[10]:
<flopy.utils.util_array.Util3d at 0x7fb234a656f0>
[11]:
fname = f"{outdir}/hk.shp"
gdf = m.lpf.hk.to_geodataframe()
gdf.to_file(fname)
[12]:
ax = plt.subplot(1, 1, 1, aspect="equal")
extents = grid.extent
a = m.lpf.hk.array.ravel()
pc = flopy.plot.plot_shapefile(fname, ax=ax, a=a)
ax.set_xlim(extents[0], extents[1])
ax.set_ylim(extents[2], extents[3])
ax.set_title(fname)
[12]:
Text(0.5, 1.0, '/tmp/tmpww0yjrvu/shapefile_export/hk.shp')

[13]:
m.riv.stress_period_data
[13]:
<flopy.utils.util_list.MfList at 0x7fb234a65270>
[14]:
gdf = m.riv.stress_period_data.to_geodataframe()
gdf.to_file(f"{outdir}/riv_spd.shp")
/tmp/ipykernel_10398/1908606549.py:2: UserWarning: Column names longer than 10 characters will be truncated when saved to ESRI Shapefile.
  gdf.to_file(f"{outdir}/riv_spd.shp")
MfList.to_geodataframe() exports the whole grid by default, regardless of the locations of the boundary cells
full_grid=False only exports the boundary cells in the MfList
[15]:
gdf = m.riv.stress_period_data.to_geodataframe(full_grid=False)
gdf.to_file(f"{outdir}/riv_spd.shp")
/tmp/ipykernel_10398/3769670249.py:2: UserWarning: Column names longer than 10 characters will be truncated when saved to ESRI Shapefile.
  gdf.to_file(f"{outdir}/riv_spd.shp")
[16]:
gdf = m.wel.stress_period_data.to_geodataframe(full_grid=False)
gdf.to_file(f"{outdir}/wel_spd.shp")
/tmp/ipykernel_10398/1817683957.py:2: UserWarning: Column names longer than 10 characters will be truncated when saved to ESRI Shapefile.
  gdf.to_file(f"{outdir}/wel_spd.shp")
Ad-hoc exporting using to_geodataframe()
combining data from different packages
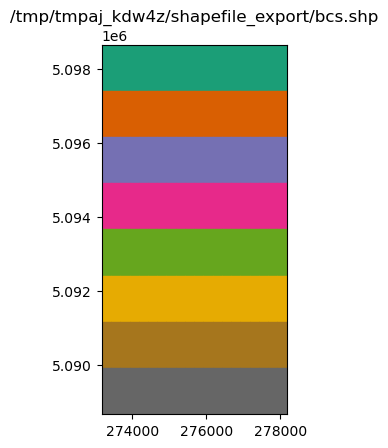
write a shapefile of RIV and WEL package cells
[17]:
gdf = m.wel.stress_period_data.to_geodataframe(shorten_attr=True)
gdf = m.riv.stress_period_data.to_geodataframe(gdf=gdf, shorten_attr=True)
gdf.head()
[17]:
| geometry | node | row | col | active | flux00 | ifac00 | stag00 | cond00 | rbot00 | |
|---|---|---|---|---|---|---|---|---|---|---|
| 0 | POLYGON ((273170 5098657, 273170 5098407, 2734... | 1 | 1 | 1 | 1 | NaN | NaN | NaN | NaN | NaN |
| 1 | POLYGON ((273420 5098657, 273420 5098407, 2736... | 2 | 1 | 2 | 1 | NaN | NaN | NaN | NaN | NaN |
| 2 | POLYGON ((273670 5098657, 273670 5098407, 2739... | 3 | 1 | 3 | 1 | NaN | NaN | NaN | NaN | NaN |
| 3 | POLYGON ((273920 5098657, 273920 5098407, 2741... | 4 | 1 | 4 | 1 | NaN | NaN | NaN | NaN | NaN |
| 4 | POLYGON ((274170 5098657, 274170 5098407, 2744... | 5 | 1 | 5 | 1 | NaN | NaN | NaN | NaN | NaN |
[18]:
fname = f"{outdir}/bcs.shp"
gdf.to_file(fname)
[19]:
ax = plt.subplot(1, 1, 1, aspect="equal")
extents = grid.extent
pc = flopy.plot.plot_shapefile(fname, ax=ax)
ax.set_xlim(extents[0], extents[1])
ax.set_ylim(extents[2], extents[3])
ax.set_title(fname)
[19]:
Text(0.5, 1.0, '/tmp/tmpww0yjrvu/shapefile_export/bcs.shp')
exporting other data
Suppose we have some well data with actual locations that we want to export to a shapefile
[20]:
welldata = pd.DataFrame(
    {
        "wellID": np.arange(0, 10),
        "q": np.random.randn(10) * 100 - 1000,
        "x_utm": np.random.rand(10) * 5000 + grid.xoffset,
        "y_utm": grid.yoffset + np.random.rand(10) * 10000,
    }
)
welldata.head()
[20]:
| wellID | q | x_utm | y_utm | |
|---|---|---|---|---|
| 0 | 0 | -975.128102 | 274685.087049 | 5.094121e+06 |
| 1 | 1 | -952.958722 | 273461.087187 | 5.090453e+06 |
| 2 | 2 | -1094.393326 | 277395.362631 | 5.097035e+06 |
| 3 | 3 | -1060.877914 | 277519.589813 | 5.089937e+06 |
| 4 | 4 | -1029.738316 | 274604.524821 | 5.089453e+06 |
[21]:
from flopy.utils.geometry import Point
from flopy.utils.geospatial_utils import GeoSpatialCollection

geoms = [Point(x, y) for x, y in zip(welldata.x_utm, welldata.y_utm)]
geoms = GeoSpatialCollection(geoms, "Point").shape

gdf = gpd.GeoDataFrame(welldata, geometry=geoms)
gdf.to_file(f"{outdir}/wel_data.shp")
/home/runner/work/flopy/flopy/modflow6/.pixi/envs/rtd/lib/python3.10/site-packages/pyogrio/geopandas.py:710: UserWarning: 'crs' was not provided.  The output dataset will not have projection information defined and may not be usable in other systems.
  write(
[22]:
ax = plt.subplot(1, 1, 1, aspect="equal")
extents = grid.extent
pc = flopy.plot.plot_shapefile(fname, ax=ax, radius=100)
ax.set_xlim(extents[0], extents[1])
ax.set_ylim(extents[2], extents[3])
ax.set_title(fname)
[22]:
Text(0.5, 1.0, '/tmp/tmpww0yjrvu/shapefile_export/bcs.shp')

Adding attribute data to an existing shapefile
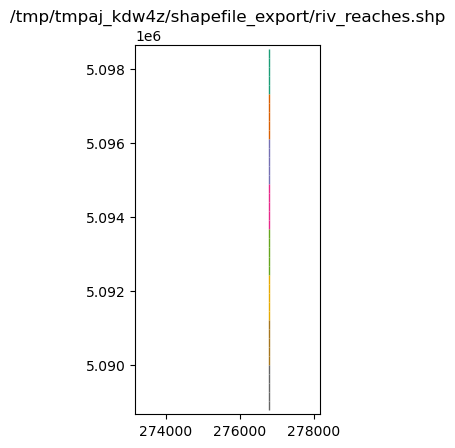
Suppose we have a GIS coverage representing the river in the riv package
[23]:
from flopy.utils.geometry import LineString

# make up a linestring shapefile of the river reaches
i, j = m.riv.stress_period_data[0].i, m.riv.stress_period_data[0].j
x0 = grid.xyzcellcenters[0][i[0], j[0]]
x1 = grid.xyzcellcenters[0][i[-1], j[-1]]
y0 = grid.xyzcellcenters[1][i[0], j[0]]
y1 = grid.xyzcellcenters[1][i[-1], j[-1]]
x = np.linspace(x0, x1, m.nrow + 1)
y = np.linspace(y0, y1, m.nrow + 1)
l0 = zip(list(zip(x[:-1], y[:-1])), list(zip(x[1:], y[1:])))
lines = [LineString(l) for l in l0]

gdf = gpd.GeoDataFrame(data=m.riv.stress_period_data[0], geometry=lines)
gdf["reach"] = np.arange(len(lines))
gdf = gdf.set_crs(epsg=grid.epsg)

lines_shapefile = f"{outdir}/riv_reaches.shp"
gdf.to_file(lines_shapefile)
[24]:
ax = plt.subplot(1, 1, 1, aspect="equal")
extents = grid.extent
pc = flopy.plot.plot_shapefile(lines_shapefile, ax=ax, radius=25)
ax.set_xlim(extents[0], extents[1])
ax.set_ylim(extents[2], extents[3])
ax.set_title(lines_shapefile)
[24]:
Text(0.5, 1.0, '/tmp/tmpww0yjrvu/shapefile_export/riv_reaches.shp')

read_file() reads a geospatial file into a GeoDataFrame
[25]:
linesdata = gpd.read_file(lines_shapefile)
linesdata.head()
[25]:
| k | i | j | stage | cond | rbot | iface | reach | geometry | |
|---|---|---|---|---|---|---|---|---|---|
| 0 | 0 | 0 | 14 | 20.100000 | 0.05 | 20.00 | 0.0 | 0 | LINESTRING (276795 5098532, 276795 5098288.25) |
| 1 | 0 | 1 | 14 | 19.870001 | 0.05 | 19.75 | 0.0 | 1 | LINESTRING (276795 5098288.25, 276795 5098044.5) |
| 2 | 0 | 2 | 14 | 19.650000 | 0.05 | 19.50 | 0.0 | 2 | LINESTRING (276795 5098044.5, 276795 5097800.75) |
| 3 | 0 | 3 | 14 | 19.420000 | 0.05 | 19.25 | 0.0 | 3 | LINESTRING (276795 5097800.75, 276795 5097557) |
| 4 | 0 | 4 | 14 | 19.190001 | 0.05 | 19.00 | 0.0 | 4 | LINESTRING (276795 5097557, 276795 5097313.25) |
[26]:
# make up some fluxes between the river and aquifer at each reach
q = np.random.randn(len(linesdata)) + 1
q
[26]:
array([-0.18105176, -0.07675051,  1.81479852,  1.74558935,  0.89478104,
        2.25701229,  1.9505716 ,  1.39212834,  0.64406039,  0.72536276,
        0.33137136,  1.42318433,  1.38564194,  0.67447397,  0.27542857,
        0.7294232 ,  2.07848226,  1.66480808,  1.9463496 ,  0.95260368,
        1.23850973,  1.01775715,  2.50306884,  1.09504029,  1.02601396,
        0.68042873, -1.02875433,  0.76469486,  1.14750659,  1.5585162 ,
        0.49354726,  1.90406541,  0.85560877, -0.61855506,  1.4546229 ,
        1.94607062,  1.63702952,  1.64532578,  2.9353186 ,  0.62432615])
[27]:
linesdata["qreach"] = q
linesdata["qstream"] = np.cumsum(q)
linesdata.to_file(lines_shapefile)
[28]:
ax = plt.subplot(1, 1, 1, aspect="equal")
extents = grid.extent
pc = flopy.plot.plot_shapefile(lines_shapefile, ax=ax, radius=25)
ax.set_xlim(extents[0], extents[1])
ax.set_ylim(extents[2], extents[3])
ax.set_title(lines_shapefile)
[28]:
Text(0.5, 1.0, '/tmp/tmpww0yjrvu/shapefile_export/riv_reaches.shp')
Overriding the model’s modelgrid with a user supplied modelgrid
In some cases it may be necessary to override the model’s modelgrid instance with a seperate modelgrid. An example of this is if the model discretization is in feet and the user would like it projected in meters. Exporting can be accomplished by supplying a GeoDataFrame in the to_geodataframe() methods within flopy. Below is an example:
[29]:
mg0 = m.modelgrid

# build a new modelgrid instance with discretization in meters
modelgrid = flopy.discretization.StructuredGrid(
    delc=mg0.delc * 0.3048,
    delr=mg0.delr * 0.3048,
    top=mg0.top,
    botm=mg0.botm,
    idomain=mg0.idomain,
    xoff=mg0.xoffset * 0.3048,
    yoff=mg0.yoffset * 0.3048,
)

# exporting an entire model
gdf = modelgrid.to_geodataframe()

gdf = m.to_geodataframe(gdf=gdf)
gdf.to_file(f"{outdir}/freyberg.shp")
/tmp/ipykernel_10398/2460639621.py:18: UserWarning: Column names longer than 10 characters will be truncated when saved to ESRI Shapefile.
  gdf.to_file(f"{outdir}/freyberg.shp")
/home/runner/work/flopy/flopy/modflow6/.pixi/envs/rtd/lib/python3.10/site-packages/pyogrio/geopandas.py:710: UserWarning: 'crs' was not provided.  The output dataset will not have projection information defined and may not be usable in other systems.
  write(
And for a specific parameter the method is the same
[30]:
fname = f"{outdir}/hk.shp"
gdf = modelgrid.to_geodataframe()
gdfhk = m.lpf.hk.to_geodataframe(gdf=gdf)
gdfhk.to_file(fname)
/home/runner/work/flopy/flopy/modflow6/.pixi/envs/rtd/lib/python3.10/site-packages/pyogrio/geopandas.py:710: UserWarning: 'crs' was not provided.  The output dataset will not have projection information defined and may not be usable in other systems.
  write(
[31]:
ax = plt.subplot(1, 1, 1, aspect="equal")
extents = modelgrid.extent
a = m.lpf.hk.array.ravel()
pc = flopy.plot.plot_shapefile(fname, ax=ax, a=a)
ax.set_xlim(extents[0], extents[1])
ax.set_ylim(extents[2], extents[3])
ax.set_title(fname)
[31]:
Text(0.5, 1.0, '/tmp/tmpww0yjrvu/shapefile_export/hk.shp')

[32]:
try:
    # ignore PermissionError on Windows
    temp_dir.cleanup()
except:
    pass