Note
This page was generated from Notebooks/groundwater2023_watershed_example. Download as  .
.
a Jupyter notebook (.ipynb) or Python script (.py) or launch interactively with Binder Watershed geoprocessing example
From Hughes, Joseph D., Langevin, Christian D., Paulinski, Scott R., Larsen, Joshua D., and Brakenhoff, David, 2023, FloPy Workflows for Creating Structured and Unstructured MODFLOW Models: Groundwater, https://doi.org/10.1111/gwat.13327
[1]:
import os
import pathlib as pl
import sys
[2]:
import matplotlib as mpl
import matplotlib.gridspec as gridspec
import matplotlib.pyplot as plt
import numpy as np
from shapely.geometry import LineString
[3]:
import flopy
import flopy.plot.styles as styles
from flopy.discretization import StructuredGrid, VertexGrid
from flopy.utils.gridgen import Gridgen
from flopy.utils.triangle import Triangle
from flopy.utils.voronoi import VoronoiGrid
[4]:
print(sys.version)
print("numpy version: {}".format(np.__version__))
print("matplotlib version: {}".format(mpl.__version__))
print("flopy version: {}".format(flopy.__version__))
3.8.17 (default, Jun  7 2023, 12:29:56)
[GCC 11.3.0]
numpy version: 1.24.4
matplotlib version: 3.7.2
flopy version: 3.4.2
[5]:
# import all plot style information from defaults.py
sys.path.append("../common")
from groundwater2023_utils import (
    densify_geometry,
    geometries,
    set_idomain,
    string2geom,
)
[6]:
# basic figure size
figwidth = 180  # 90 # mm
figwidth = figwidth / 10 / 2.54  # inches
figheight = figwidth
figsize = (figwidth, figheight)
[7]:
# figure settings
levels = np.arange(10, 110, 10)
contour_color = "black"
contour_style = "--"
contour_dict = {
    "levels": levels,
    "linewidths": 0.5,
    "colors": contour_color,
    "linestyles": contour_style,
}
clabel_dict = {
    "inline": True,
    "fmt": "%1.0f",
    "fontsize": 6,
    "inline_spacing": 0.5,
}
font_dict = {
    "fontsize": 5,
    "color": "black",
}
grid_dict = {
    "lw": 0.25,
    "color": "0.5",
}
refinement_dict = {
    "color": "magenta",
    "ls": ":",
    "lw": 1.0,
}
river_dict = {
    "color": "blue",
    "linestyle": "-",
    "linewidth": 1,
}
intersection_cmap = "Pastel2"
temp_cmap = mpl.colormaps[intersection_cmap]
intersection_rgba = temp_cmap(0)
[8]:
# make a temporary working directory for gridgen output
temp_path = "./temp"
if not os.path.isdir(temp_path):
    os.mkdir(temp_path)
[9]:
# Load the fine topography that will be sampled
ascii_file = pl.Path("../../examples/data/geospatial/fine_topo.asc")
fine_topo = flopy.utils.Raster.load(ascii_file)
Define the problem size and extents
[10]:
Lx = 180000
Ly = 100000
extent = (0, Lx, 0, Ly)
vmin, vmax = 0.0, 100.0
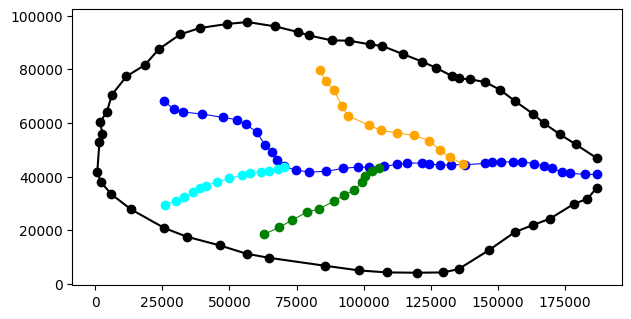
Create boundary and river data that will be used to refine the unstructured grids
[11]:
boundary_polygon = string2geom(geometries["boundary"])
bp = np.array(boundary_polygon)

sgs = [string2geom(geometries[f"streamseg{i}"]) for i in range(1, 5)]

fig = plt.figure(figsize=figsize)
ax = fig.add_subplot()
ax.set_aspect("equal")

riv_colors = ("blue", "cyan", "green", "orange", "red")

ax.plot(bp[:, 0], bp[:, 1], "ko-")
for idx, sg in enumerate(sgs):
    sa = np.array(sg)
    ax.plot(sa[:, 0], sa[:, 1], color=riv_colors[idx], lw=0.75, marker="o")
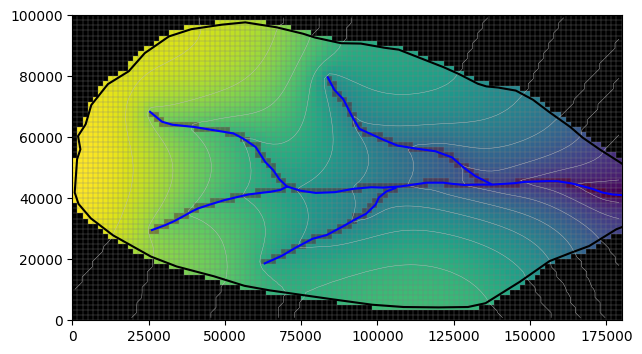
Structured Grids
Structured grid with constant row and column spacing
[12]:
dx = dy = 1666.66666667
nlay = 1
nrow = int(Ly / dy) + 1
ncol = int(Lx / dx) + 1
delr = np.array(ncol * [dx])
delc = np.array(nrow * [dy])
top = np.ones((nrow, ncol)) * 1000.0
botm = np.ones((nlay, nrow, ncol)) * -100.0
struct_grid = StructuredGrid(
    nlay=nlay, delr=delr, delc=delc, xoff=0.0, yoff=0.0, top=top, botm=botm
)

set_idomain(struct_grid, boundary_polygon)
[13]:
top_sg = fine_topo.resample_to_grid(
    struct_grid,
    band=fine_topo.bands[0],
    method="linear",
    extrapolate_edges=True,
)
[14]:
ixs = flopy.utils.GridIntersect(struct_grid, method="structured")
cellids = []
for sg in sgs:
    v = ixs.intersect(LineString(sg), sort_by_cellid=True)
    cellids += v["cellids"].tolist()
intersection_sg = np.zeros(struct_grid.shape[1:])
for loc in cellids:
    intersection_sg[loc] = 1
[15]:
fig = plt.figure(figsize=figsize)
ax = fig.add_subplot()
pmv = flopy.plot.PlotMapView(modelgrid=struct_grid)
ax.set_aspect("equal")
pmv.plot_array(top_sg)
pmv.plot_array(
    intersection_sg,
    masked_values=[
        0,
    ],
    alpha=0.2,
    cmap="Reds_r",
)
pmv.plot_grid(lw=0.25, color="0.5")
cg = pmv.contour_array(top_sg, levels=levels, linewidths=0.3, colors="0.75")
pmv.plot_inactive()

ax.plot(bp[:, 0], bp[:, 1], "k-")
for sg in sgs:
    sa = np.array(sg)
    ax.plot(sa[:, 0], sa[:, 1], "b-")
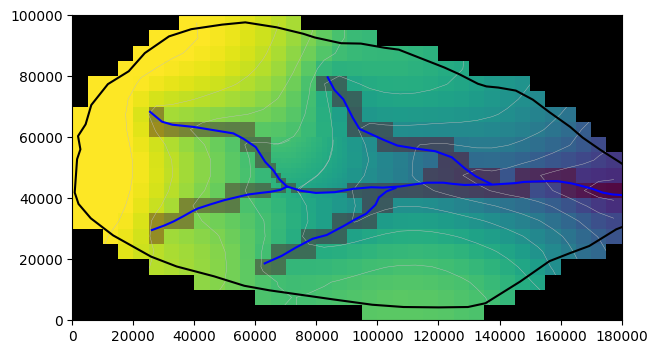
Structured grid with variable row and column spacing
[16]:
dx = dy = 5000

# create transition cells
multiplier = 1.175
transition = 20000.0
ncells = 7
smoothr = [
    transition * (multiplier - 1.0) / (multiplier ** float(ncells) - 1.0)
]
for i in range(ncells - 1):
    smoothr.append(smoothr[i] * multiplier)
smooth = smoothr.copy()
smooth.reverse()
[17]:
# build the structured grid with variable row and column spacing
dx = 9 * [5000] + smooth + 15 * [1666.66666667] + smoothr + 14 * [5000]
dy = 4 * [5000] + smooth + 12 * [1666.66666667] + smoothr + 4 * [5000]

nlay = 1
ncol = len(dx)
nrow = len(dy)

top = np.ones((nrow, ncol)) * 1000.0
botm = np.ones((nlay, nrow, ncol)) * -100.0

delr = np.array(dx)
delc = np.array(dy)
struct_vrc_grid = StructuredGrid(
    nlay=nlay,
    delr=delr,
    delc=delc,
    xoff=0.0,
    yoff=0.0,
    top=top,
    botm=botm,
)
set_idomain(struct_vrc_grid, boundary_polygon)
[18]:
top_sg_vrc = fine_topo.resample_to_grid(
    struct_vrc_grid,
    band=fine_topo.bands[0],
    method="linear",
    extrapolate_edges=True,
)
[19]:
ixs = flopy.utils.GridIntersect(struct_vrc_grid, method="structured")
cellids = []
for sg in sgs:
    v = ixs.intersect(LineString(sg), sort_by_cellid=True)
    cellids += v["cellids"].tolist()
intersection_sg_vrc = np.zeros(struct_vrc_grid.shape[1:])
for loc in cellids:
    intersection_sg_vrc[loc] = 1
[20]:
fig = plt.figure(figsize=figsize)
ax = fig.add_subplot()
pmv = flopy.plot.PlotMapView(modelgrid=struct_vrc_grid)
ax.set_aspect("equal")
pmv.plot_array(top_sg_vrc)
pmv.plot_array(
    intersection_sg_vrc,
    masked_values=[
        0,
    ],
    alpha=0.2,
    cmap="Reds_r",
)
cg = pmv.contour_array(
    top_sg_vrc, levels=levels, linewidths=0.3, colors="0.75"
)
pmv.plot_inactive()

ax.plot(bp[:, 0], bp[:, 1], "k-")
for sg in sgs:
    sa = np.array(sg)
    ax.plot(sa[:, 0], sa[:, 1], "b-", alpha=0.2)

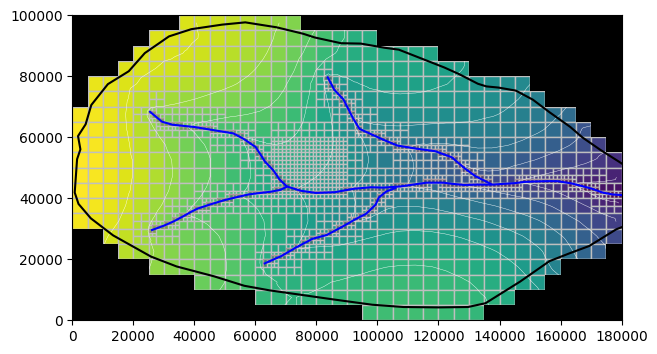
Local grid refinement grid
[21]:
from flopy.utils.lgrutil import Lgr

nlayp = 1
dx = 5000
nrowp = int(Ly / dx)
ncolp = int(Lx / dx)
delrp = dx
delcp = dx
# topp = 1000.0
# botmp = [-100.]
topp = np.ones((nrowp, ncolp)) * 1000.0
botmp = np.ones((nlayp, nrowp, ncolp)) * -100.0

idomainp = np.ones((nlayp, nrowp, ncolp), dtype=int)
idomainp[0, 8:12, 13:18] = 0

ncpp = 3
ncppl = [1]

lgr = Lgr(
    nlayp,
    nrowp,
    ncolp,
    delrp,
    delcp,
    topp,
    botmp,
    idomainp,
    ncpp=ncpp,
    ncppl=ncppl,
    xllp=0.0,
    yllp=0.0,
)

delr = np.array(ncolp * [dx])
delc = np.array(nrowp * [dx])
struct_gridp = StructuredGrid(
    nlay=1, delr=delr, delc=delc, idomain=idomainp, top=topp, botm=botmp
)
set_idomain(struct_gridp, boundary_polygon)

delr_child, delc_child = lgr.get_delr_delc()
xoff, yoff = lgr.get_lower_left()
nrowc, ncolc = delc_child.shape[0], delr_child.shape[0]
topc = np.ones((nrowc, ncolc)) * 1000.0
botmc = np.ones((nlayp, nrowc, ncolc)) * -100.0
struct_gridc = StructuredGrid(
    delr=delr_child,
    delc=delc_child,
    xoff=xoff,
    yoff=yoff,
    idomain=idomainp,
    top=topc,
    botm=botmc,
)

extent_child = struct_gridc.extent

nested_grid = [struct_gridp, struct_gridc]
[22]:
top_ngp = fine_topo.resample_to_grid(
    struct_gridp,
    band=fine_topo.bands[0],
    method="linear",
    extrapolate_edges=True,
)
top_ngc = fine_topo.resample_to_grid(
    struct_gridc,
    band=fine_topo.bands[0],
    method="linear",
    extrapolate_edges=True,
)
top_nested_grid = [top_ngp, top_ngc]
[23]:
ixs = flopy.utils.GridIntersect(struct_gridp, method="structured")
cellids = []
for sg in sgs:
    v = ixs.intersect(LineString(sg), sort_by_cellid=True)
    cellids += v["cellids"].tolist()
intersection_ngp = np.zeros(struct_gridp.shape[1:])
for loc in cellids:
    intersection_ngp[loc] = 1
intersection_ngp[idomainp[0] == 0] = 0

ixs = flopy.utils.GridIntersect(struct_gridc, method="structured")
cellids = []
for sg in sgs:
    v = ixs.intersect(LineString(sg), sort_by_cellid=True)
    cellids += v["cellids"].tolist()
intersection_ngc = np.zeros(struct_gridc.shape[1:])
for loc in cellids:
    intersection_ngc[loc] = 1

intersection_nested_grid = [intersection_ngp, intersection_ngc]
[24]:
fig = plt.figure(figsize=figsize)
ax = fig.add_subplot()
pmv = flopy.plot.PlotMapView(modelgrid=struct_gridp, extent=extent)
pmv.plot_inactive()
pmv.plot_array(top_ngp, vmin=vmin, vmax=vmax)
pmv.plot_array(
    intersection_nested_grid[0],
    masked_values=[
        0,
    ],
    alpha=0.2,
    cmap="Reds_r",
)
cgp = pmv.contour_array(top_ngp, levels=levels, linewidths=0.3, colors="0.75")
pmv.plot_inactive(zorder=100)
ax.set_aspect("equal")

pmvc = flopy.plot.PlotMapView(modelgrid=struct_gridc, ax=ax, extent=extent)
# pmvc.plot_grid()
pmvc.plot_array(top_ngc, vmin=vmin, vmax=vmax)
pmvc.plot_array(
    intersection_nested_grid[1],
    masked_values=[
        0,
    ],
    alpha=0.2,
    cmap="Reds_r",
)
cgc = pmvc.contour_array(top_ngc, levels=levels, linewidths=0.3, colors="0.75")

ax.plot(bp[:, 0], bp[:, 1], "k-")
for sg in sgs:
    sa = np.array(sg)
    ax.plot(sa[:, 0], sa[:, 1], "b-")
Unstructured grids
[25]:
# create a polygon of the common refinement area for the quadtree grid
lgr_poly = [
    [
        (extent_child[0], extent_child[2]),
        (extent_child[0], extent_child[3]),
        (extent_child[1], extent_child[3]),
        (extent_child[1], extent_child[2]),
        (extent_child[0], extent_child[2]),
    ]
]
Quadtree grid
[26]:
sim = flopy.mf6.MFSimulation()
gwf = gwf = flopy.mf6.ModflowGwf(sim)
dx = dy = 5000.0
nr = int(Ly / dy)
nc = int(Lx / dx)
dis6 = flopy.mf6.ModflowGwfdis(
    gwf,
    nrow=nr,
    ncol=nc,
    delr=dy,
    delc=dx,
)
g = Gridgen(gwf.modelgrid, model_ws=temp_path)
adpoly = [
    [[(1000, 1000), (3000, 1000), (3000, 2000), (1000, 2000), (1000, 1000)]]
]
adpoly = boundary_polygon + [boundary_polygon[0]]
adpoly = [[adpoly]]
g.add_refinement_features([lgr_poly], "polygon", 2, range(1))

refine_line = sgs
g.add_refinement_features(refine_line, "line", 2, range(1))
g.build(verbose=False)

gridprops_vg = g.get_gridprops_vertexgrid()
quadtree_grid = flopy.discretization.VertexGrid(**gridprops_vg)
set_idomain(quadtree_grid, boundary_polygon)
[27]:
top_qg = fine_topo.resample_to_grid(
    quadtree_grid,
    band=fine_topo.bands[0],
    method="linear",
    extrapolate_edges=True,
)
[28]:
ixs = flopy.utils.GridIntersect(quadtree_grid, method="vertex")
cellids = []
for sg in sgs:
    v = ixs.intersect(LineString(sg), sort_by_cellid=True)
    cellids += v["cellids"].tolist()
intersection_qg = np.zeros(quadtree_grid.shape[1:])
for loc in cellids:
    intersection_qg[loc] = 1
[29]:
fig = plt.figure(figsize=figsize)
ax = fig.add_subplot()
pmv = flopy.plot.PlotMapView(modelgrid=quadtree_grid)
pmv.plot_array(top_qg, ec="0.75")
pmv.plot_array(
    intersection_qg,
    masked_values=[
        0,
    ],
    alpha=0.2,
    cmap="Reds_r",
)
cg = pmv.contour_array(top_qg, levels=levels, linewidths=0.3, colors="white")
pmv.plot_inactive(zorder=100)
ax.set_aspect("equal")

ax.plot(bp[:, 0], bp[:, 1], "k-")
for sg in sgs:
    sa = np.array(sg)
    ax.plot(sa[:, 0], sa[:, 1], "b-")
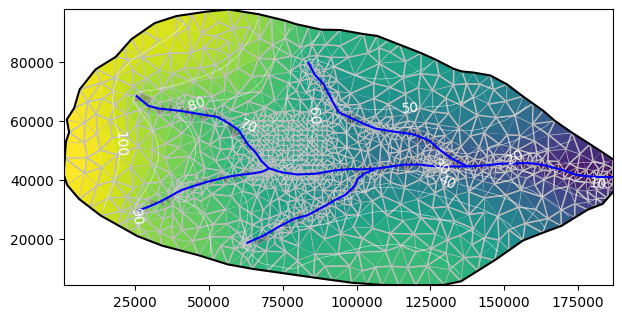
Triangular grid
[30]:
nodes = []
for sg in sgs:
    sg_densify = densify_geometry(sg, 2000)
    nodes.extend(sg_densify)
for x in struct_gridc.get_xvertices_for_layer(0)[0, :]:
    for y in struct_gridc.get_yvertices_for_layer(0)[:, 0]:
        nodes.append((x, y))
nodes = np.array(nodes)
[31]:
tri = Triangle(
    maximum_area=5000 * 5000, angle=30, nodes=nodes, model_ws=temp_path
)
poly = bp
tri.add_polygon(poly)
tri.build(verbose=False)


cell2d = tri.get_cell2d()
vertices = tri.get_vertices()

top = np.ones(tri.ncpl) * 1000.0
botm = np.ones((1, tri.ncpl)) * -100.0
idomain = np.ones((1, tri.ncpl), dtype=int)

triangular_grid = VertexGrid(
    vertices=vertices,
    cell2d=cell2d,
    idomain=idomain,
    nlay=1,
    ncpl=tri.ncpl,
    top=top,
    botm=botm,
)
[32]:
top_tg = fine_topo.resample_to_grid(
    triangular_grid,
    band=fine_topo.bands[0],
    method="linear",
    extrapolate_edges=True,
)
[33]:
ixs = flopy.utils.GridIntersect(triangular_grid)  # , method="vertex")
cellids = []
for sg in sgs:
    v = ixs.intersect(
        LineString(sg),
        return_all_intersections=True,
        keepzerolengths=False,
        sort_by_cellid=True,
    )
    cellids += v["cellids"].tolist()
intersection_tg = np.zeros(triangular_grid.shape[1:])
for loc in cellids:
    intersection_tg[loc] = 1
[34]:
fig = plt.figure(figsize=figsize)
ax = fig.add_subplot()
ax.set_aspect("equal")

pmv = flopy.plot.PlotMapView(modelgrid=triangular_grid)

pmv.plot_array(top_tg, ec="0.75")
pmv.plot_array(
    intersection_tg,
    masked_values=[
        0,
    ],
    alpha=0.2,
    cmap="Reds_r",
)
cg = pmv.contour_array(top_tg, levels=levels, linewidths=0.3, colors="white")
ax.clabel(cg, cg.levels, inline=True, fmt="%1.0f", fontsize=10)

pmv.plot_inactive(zorder=100)

if True:
    ax.plot(bp[:, 0], bp[:, 1], "k-")
    for sg in sgs:
        sa = np.array(sg)
        ax.plot(sa[:, 0], sa[:, 1], "b-")
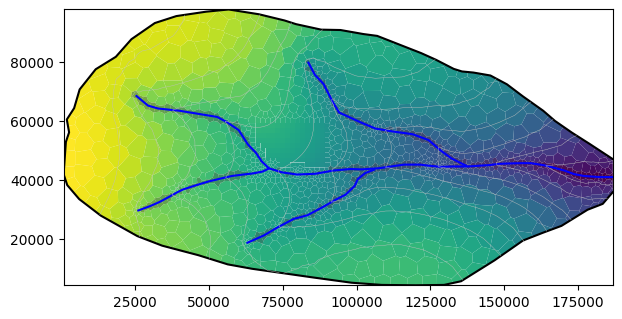
Voronoi Grid from the Triangle object
[35]:
# create vor object and VertexGrid from the triangle object tri
vor = VoronoiGrid(tri)
gridprops = vor.get_gridprops_vertexgrid()
idomain = np.ones((1, vor.ncpl), dtype=int)
voronoi_grid = VertexGrid(**gridprops, nlay=1, idomain=idomain)
[36]:
top_vg = fine_topo.resample_to_grid(
    voronoi_grid,
    band=fine_topo.bands[0],
    method="linear",
    extrapolate_edges=True,
)
[37]:
ixs = flopy.utils.GridIntersect(voronoi_grid, method="vertex")
cellids = []
for sg in sgs:
    v = ixs.intersect(
        LineString(sg),
        return_all_intersections=True,
        keepzerolengths=False,
        sort_by_cellid=True,
    )
    cellids += v["cellids"].tolist()
intersection_vg = np.zeros(voronoi_grid.shape[1:])
for loc in cellids:
    intersection_vg[loc] = 1
[38]:
fig = plt.figure(figsize=figsize)
ax = fig.add_subplot()
pmv = flopy.plot.PlotMapView(modelgrid=voronoi_grid)
ax.set_aspect("equal")
pmv.plot_array(top_vg)
pmv.plot_array(
    intersection_vg,
    masked_values=[
        0,
    ],
    alpha=0.2,
    cmap="Reds_r",
)
pmv.plot_inactive()
ax.plot(bp[:, 0], bp[:, 1], "k-")
for sg in sgs:
    sa = np.array(sg)
    ax.plot(sa[:, 0], sa[:, 1], "b-")

cg = pmv.contour_array(top_vg, levels=levels, linewidths=0.3, colors="0.75")
Plot all six grids
Create a polyline for Local Grid Refinement area
[39]:
lgr_poly_array = np.array(lgr_poly).squeeze()
Plot the grids
[40]:
# Make a plot of the six grids
figwidth = 17.15 / 2.54
figheight = 3.66 * (Ly / Lx) * 8.25 / 2.54
grids = [
    struct_grid,
    struct_vrc_grid,
    nested_grid,
    quadtree_grid,
    triangular_grid,
    voronoi_grid,
    None,
]
topo_grids = [top_sg, top_sg_vrc, top_nested_grid, top_qg, top_tg, top_vg]
extent = (0, 180000, 0, 100000)
cbar_axis = [0.0, 0.1, 0.25, 0.9]

with styles.USGSMap():
    fig = plt.figure(figsize=(figwidth, figheight), constrained_layout=True)
    gs = gridspec.GridSpec(ncols=16, nrows=17, figure=fig)
    axs = [fig.add_subplot(gs[:5, :8])]
    axs.append(fig.add_subplot(gs[:5, 8:]))
    axs.append(fig.add_subplot(gs[5:10, :8]))
    axs.append(fig.add_subplot(gs[5:10, 8:]))
    axs.append(fig.add_subplot(gs[10:15, :8]))
    axs.append(fig.add_subplot(gs[10:15, 8:]))
    axs.append(fig.add_subplot(gs[15:, :]))

    for idx, ax in enumerate(axs[:-1]):
        g = grids[idx]
        t = topo_grids[idx]
        if g is not None:
            if isinstance(g, list):
                g = g[0]
                t = t[0]

            pmv = flopy.plot.PlotMapView(modelgrid=g, ax=ax)

            v = pmv.plot_array(t)
            pmv.plot_grid(**grid_dict)
            cg = pmv.contour_array(t, **contour_dict)
            pmv.ax.clabel(cg, cg.levels, **clabel_dict)
            pmv.plot_inactive(color_noflow="gray", zorder=100)

            if isinstance(grids[idx], list):
                gg = grids[idx]
                tt = topo_grids[idx]
                for g, t in zip(gg[1:], tt[1:]):
                    pmvc = flopy.plot.PlotMapView(
                        modelgrid=g, ax=ax, extent=extent
                    )
                    pmvc.plot_array(top_ngc, vmin=vmin, vmax=vmax)
                    pmvc.plot_grid(**grid_dict)
                    cgc = pmvc.contour_array(top_ngc, **contour_dict)

            # plot lgr polyline
            ax.plot(
                lgr_poly_array[:, 0],
                lgr_poly_array[:, 1],
                zorder=101,
                **refinement_dict,
            )

            ax.set_aspect("equal")
            ax.set_axisbelow(False)

            ax.set_xlim(extent[0], extent[1])
            ax.set_xticks(np.arange(0, 200000, 50000))
            if idx in (4, 5):
                ax.set_xticklabels(np.arange(0, 200, 50))
                ax.set_xlabel("x position (km)")
            else:
                ax.set_xticklabels([])

            ax.set_ylim(extent[2], extent[3])
            ax.set_yticks(np.arange(0, 150000, 50000))
            if idx in (0, 2, 4):
                ax.set_yticklabels(np.arange(0, 150, 50))
                ax.set_ylabel("y position (km)")
            else:
                ax.set_yticklabels([])

            styles.heading(ax, idx=idx)
            if True:
                ax.plot(bp[:, 0], bp[:, 1], "k-", lw=2.0)
                for sg in sgs:
                    sa = np.array(sg)
                    ax.plot(sa[:, 0], sa[:, 1], **river_dict)

    # legend
    ax = axs[-1]
    xy0 = (-100, -100)
    ax.set_xlim(0, 1)
    ax.set_ylim(0, 1)
    ax.set_axis_off()

    ax.axhline(
        xy0[0],
        color="black",
        lw=2,
        label="Basin boundary",
    )
    ax.axhline(
        xy0[0],
        **river_dict,
        label="River",
    )
    ax.axhline(
        xy0[0],
        color=contour_color,
        lw=0.5,
        ls="--",
        label="Elevation contour",
    )
    ax.axhline(
        xy0[0],
        label="Grid refinement area",
        **refinement_dict,
    )
    ax.axhline(
        xy0[0],
        marker="s",
        mec="0.5",
        mfc="white",
        markeredgewidth=0.25,
        lw=0,
        label="Grid cell",
    )
    ax.axhline(
        xy0[0],
        marker="s",
        mec="0.5",
        mfc="gray",
        markeredgewidth=0.25,
        lw=0,
        label="Inactive area",
    )
    styles.graph_legend(
        ax,
        ncol=3,
        loc="lower center",
        labelspacing=0.5,
        columnspacing=0.6,
        handletextpad=0.3,
    )

    # colorbar
    ax = fig.add_subplot(gs[15:, 14:])
    ax.set_xlim(0, 1)
    ax.set_ylim(0, 1)
    ax.set_axis_off()
    cax = ax.inset_axes(
        cbar_axis,
    )
    #     cax.set_axisbelow(False)
    cbar = plt.colorbar(
        v,
        orientation="vertical",
        cax=cax,
        ticks=[25, 50, 75, 100],
    )
    cbar.ax.tick_params(
        labelsize=5,
        labelcolor="black",
        color="black",
        length=9,
        pad=2,
    )
    cbar.ax.set_title(
        "Elevation (m)", pad=2.5, loc="center", fontdict=font_dict
    )

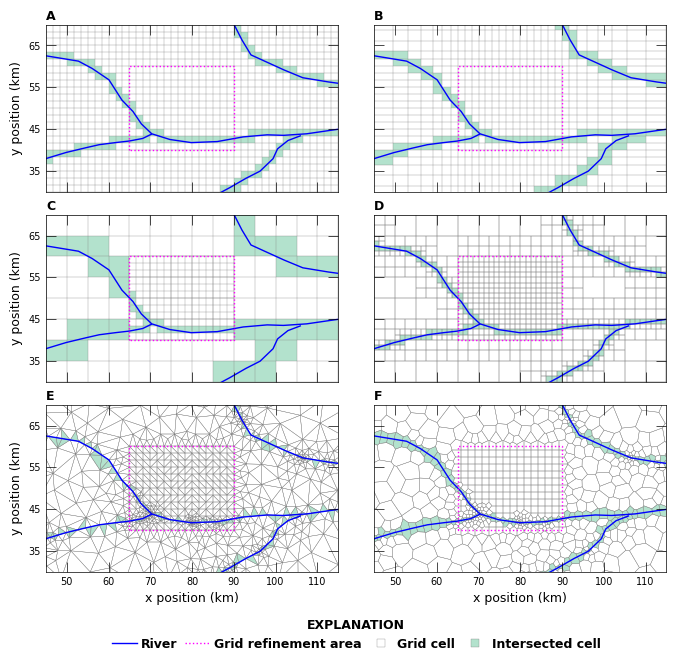
Plot the river intersection for the six grids
[41]:
figwidth = 17.15 / 2.54
figheight = 3.66 * (Ly / Lx) * 8.25 / 2.54
grids = [
    struct_grid,
    struct_vrc_grid,
    nested_grid,
    quadtree_grid,
    triangular_grid,
    voronoi_grid,
    None,
]
intersections = [
    intersection_sg,
    intersection_sg_vrc,
    intersection_nested_grid,
    intersection_qg,
    intersection_tg,
    intersection_vg,
    None,
]
extent = list(extent_child)
de = 10000.0
extent[0] -= 2.0 * de
extent[1] += 2.5 * de
extent[2] -= de
extent[3] += de


with styles.USGSMap():
    fig = plt.figure(figsize=(figwidth, figheight), constrained_layout=True)
    gs = gridspec.GridSpec(ncols=2, nrows=16, figure=fig)
    axs = [fig.add_subplot(gs[:5, 0])]
    axs.append(fig.add_subplot(gs[:5, 1]))
    axs.append(fig.add_subplot(gs[5:10, 0]))
    axs.append(fig.add_subplot(gs[5:10, 1]))
    axs.append(fig.add_subplot(gs[10:15, 0]))
    axs.append(fig.add_subplot(gs[10:15, 1]))
    axs.append(fig.add_subplot(gs[15:, :]))

    for idx, ax in enumerate(axs[:-1]):
        g = grids[idx]
        t = intersections[idx]
        if g is not None:
            if isinstance(g, list):
                g = g[0]
                t = t[0]

            pmv = flopy.plot.PlotMapView(modelgrid=g, ax=ax, extent=extent)

            v = pmv.plot_array(t, masked_values=(0,), cmap=intersection_cmap)
            pmv.plot_grid(**grid_dict)

            pmv.plot_inactive(color_noflow="gray", zorder=100)

            if isinstance(grids[idx], list):
                gg = grids[idx]
                tt = intersections[idx]
                for g, t in zip(gg[1:], tt[1:]):
                    pmvc = flopy.plot.PlotMapView(
                        modelgrid=g, ax=ax, extent=extent
                    )
                    pmvc.plot_array(
                        t, masked_values=(0,), cmap=intersection_cmap
                    )
                    pmvc.plot_grid(**grid_dict)

            # plot lgr polyline
            ax.plot(
                lgr_poly_array[:, 0],
                lgr_poly_array[:, 1],
                zorder=101,
                **refinement_dict,
            )

            ax.set_aspect("equal")
            ax.set_axisbelow(False)

            ax.set_xlim(extent[0], extent[1])
            ax.set_xticks(np.arange(50000, 120000, 10000))
            if idx in (4, 5):
                ax.set_xticklabels(np.arange(50, 120, 10))
                ax.set_xlabel("x position (km)")
            else:
                ax.set_xticklabels([])

            ax.set_ylim(extent[2], extent[3])
            ax.set_yticks(np.arange(35000, 70000, 10000))
            if idx in (0, 2, 4):
                ax.set_yticklabels(np.arange(35, 75, 10))
                ax.set_ylabel("y position (km)")
            else:
                ax.set_yticklabels([])

            styles.heading(ax, idx=idx)
            if True:
                ax.plot(bp[:, 0], bp[:, 1], "k-", lw=2.0)
                for sg in sgs:
                    sa = np.array(sg)
                    ax.plot(sa[:, 0], sa[:, 1], **river_dict)

    # legend
    ax = axs[-1]
    xy0 = (-100, -100)
    ax.set_xlim(0, 1)
    ax.set_ylim(0, 1)
    ax.set_axis_off()

    ax.axhline(xy0[0], **river_dict, label="River")
    ax.axhline(
        xy0[0],
        label="Grid refinement area",
        **refinement_dict,
    )
    ax.axhline(
        xy0[0],
        marker="s",
        mec="0.5",
        mfc="white",
        markeredgewidth=0.25,
        lw=0,
        label="Grid cell",
    )
    ax.axhline(
        xy0[0],
        marker="s",
        mfc=intersection_rgba,
        mec="0.5",
        markeredgewidth=0.25,
        lw=0,
        label="Intersected cell",
    )
    styles.graph_legend(
        ax,
        ncol=4,
        loc="lower center",
        labelspacing=0.5,
        columnspacing=0.6,
        handletextpad=0.3,
    )