[1]:
# ---
# jupyter:
#   jupytext:
#     notebook_metadata_filter: all
#     text_representation:
#       extension: .py
#       format_name: percent
#       format_version: '1.3'
#       jupytext_version: 1.18.1
#   kernelspec:
#     display_name: flopy
#     language: python
#     name: python3
#   language_info:
#     codemirror_mode:
#       name: ipython
#       version: 3
#     file_extension: .py
#     mimetype: text/x-python
#     name: python
#     nbconvert_exporter: python
#     pygments_lexer: ipython3
#     version: 3.13.7
#   metadata:
#     section: dis
# ---
Intersecting model grids with shapes
Note: This feature requires the shapely package (which is an optional FloPy dependency).
This notebook shows the grid intersection functionality in flopy. The intersection methods are available through the GridIntersect object. A flopy modelgrid is passed to instantiate the object. Then the modelgrid can be intersected with Points, LineStrings and Polygons and their Multi variants.
Table of Contents
GridIntersect Class
Rectangular regular grid
Polygon with regular grid
MultiLineString with regular grid
MultiPoint with regular grid
Vertex grid
Polygon with triangular grid
MultiLineString with triangular grid
MultiPoint with triangular grid
Import packages
[2]:
import sys

import matplotlib as mpl
import matplotlib.pyplot as plt
import numpy as np
import shapely
from shapely.geometry import LineString, MultiLineString, MultiPoint, Point, Polygon

import flopy
import flopy.discretization as fgrid
import flopy.plot as fplot
from flopy.utils import GridIntersect

print(sys.version)
print(f"numpy version: {np.__version__}")
print(f"matplotlib version: {mpl.__version__}")
print(f"shapely version: {shapely.__version__}")
print(f"flopy version: {flopy.__version__}")
3.10.18 | packaged by conda-forge | (main, Jun  4 2025, 14:45:41) [GCC 13.3.0]
numpy version: 2.2.6
matplotlib version: 3.10.6
shapely version: 2.1.2
flopy version: 3.11.0.dev0
GridIntersect Class
The GridIntersect class is constructed by passing a flopy modelgrid object to the constructor. There are options users can select to change how the intersection is calculated.
rtree: eitherTrue(default) orFalse. When True, an STR-tree is built, which allows for fast spatial queries. Building the STR-tree takes some time however. Setting the option to False avoids building the STR-tree but requires the intersection calculation to loop through more candidate grid cells. It is generally recommended to set this option to True.local: eitherFalse(default) orTrue. When True the local model coordinates are used. When False, real-world coordinates are used. Can be useful if shapes are defined in local coordinates.
The important methods in the GridIntersect object are:
intersects(): returns cellids for gridcells that intersect a shape (accepts shapely geometry objects, arrays of shapely geometry objects, flopy geometry object, shapefile.Shape objects, and geojson objects).intersect(): for intersecting the modelgrid with point, linestrings, and polygon geometries (accepts shapely geometry objects, flopy geometry object, shapefile.Shape objects, and geojson objects)points_to_cellids(): for quickly locating points in the modelgrid and getting a 1:1 mapping of points to cellids. Especially useful when passing in array of points.ix.plot_intersection_result(): for plotting intersection results
In the following sections examples of intersections are shown for structured and vertex grids for different types of shapes (Polygon, LineString and Point).
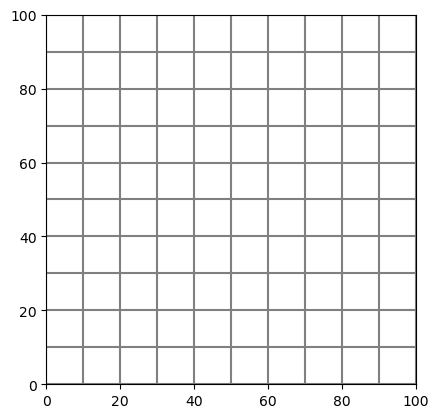
Rectangular regular grid
[3]:
delc = 10 * np.ones(10, dtype=float)
delr = 10 * np.ones(10, dtype=float)
[4]:
xoff = 0.0
yoff = 0.0
angrot = 0.0
sgr = fgrid.StructuredGrid(
    delc,
    delr,
    top=np.ones(100).reshape((10, 10)),
    botm=np.zeros(100).reshape((1, 10, 10)),
    xoff=xoff,
    yoff=yoff,
    angrot=angrot,
)
[5]:
sgr.plot()
[5]:
<matplotlib.collections.LineCollection at 0x7f01aeaaada0>
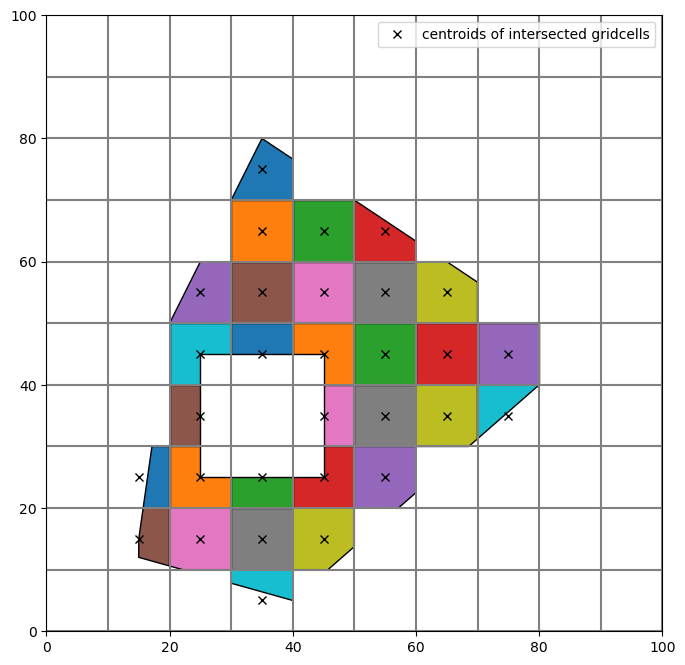
Polygon with regular grid
Polygon to intersect with:
[6]:
p = Polygon(
    shell=[(15, 15), (20, 50), (35, 80.0), (80, 50), (80, 40), (40, 5), (15, 12)],
    holes=[[(25, 25), (25, 45), (45, 45), (45, 25)]],
)
[7]:
# Create the GridIntersect class for our modelgrid.
gi = GridIntersect(sgr)
Do the intersect operation for a polygon
[8]:
result = gi.intersect(p, geo_dataframe=False)
The results are returned as a geopandas.GeoDataFrame or numpy.recarray containing several fields based on the intersection performed. An explanation of the data in each of the possible columns is given below:
cellid: contains the cell ids of the intersected grid cellsrow: contains the row index of the intersected grid cells (only for structured grids)col: contains the column index of the intersected grid cells (only for structured grids)areas: contains the area of the polygon in that grid cell (only for polygons)lengths: contains the length of the linestring in that grid cell (only for linestrings)ixshapes/geometry: contains the shapely object representing the intersected shape (useful for plotting the result)
Note: The cellids column is deprecated since flopy 3.11 but still included in the result for backward compatibility. It contains (row, column) tuples for structured grids and cellids for vertex grids.
Looking at the first few entries of the results of the polygon intersection. Note that you can convert the result to a GeoDataFrame (if geopandas is installed) with geo_dataframe=True.
[9]:
gi.intersect(p, geo_dataframe=True).head()
[9]:
| cellids | cellid | row | col | geometry | areas | |
|---|---|---|---|---|---|---|
| 0 | (2, 3) | 23 | 2 | 3 | POLYGON ((35 80, 40 76.66667, 40 70, 30 70, 35... | 66.666667 |
| 1 | (2, 4) | 24 | 2 | 4 | POLYGON ((50 70, 40 70, 40 76.66667, 50 70)) | 33.333333 |
| 2 | (3, 2) | 32 | 3 | 2 | POLYGON ((30 70, 30 60, 25 60, 30 70)) | 25.000000 |
| 3 | (3, 3) | 33 | 3 | 3 | POLYGON ((40 70, 40 60, 30 60, 30 70, 40 70)) | 100.000000 |
| 4 | (3, 4) | 34 | 3 | 4 | POLYGON ((50 70, 50 60, 40 60, 40 70, 50 70)) | 100.000000 |
The rows and columns can be easily obtained.
[10]:
result.row, result.col
[10]:
(array([2, 2, 3, 3, 3, 3, 3, 4, 4, 4, 4, 4, 4, 5, 5, 5, 5, 5, 5, 5, 6, 6,
        6, 6, 6, 6, 7, 7, 7, 7, 7, 7, 8, 8, 8, 8, 8, 9, 9, 9]),
 array([3, 4, 2, 3, 4, 5, 6, 2, 3, 4, 5, 6, 7, 1, 2, 3, 4, 5, 6, 7, 1, 2,
        4, 5, 6, 7, 1, 2, 3, 4, 5, 6, 1, 2, 3, 4, 5, 2, 3, 4]))
Or the areas
[11]:
result.areas
[11]:
array([ 66.66666667,  33.33333333,  25.        , 100.        ,
       100.        ,  66.66666667,   8.33333333,  75.        ,
       100.        , 100.        , 100.        ,  91.66666667,
        33.33333333,   7.14285714,  75.        ,  50.        ,
        75.        , 100.        , 100.        , 100.        ,
        21.42857143,  50.        ,  50.        , 100.        ,
        99.10714286,  43.75      ,  35.71428571,  75.        ,
        50.        ,  75.        ,  96.42857143,  32.14285714,
        41.71428571,  99.35714286, 100.        ,  91.96428571,
        22.32142857,   8.64285714,  36.        ,  14.28571429])
If a user is only interested in which cells the shape intersects (and not the areas or the actual shape of the intersected object) with there is also the intersects() method. This method works for all types of shapely geometries including arrays of shapely geometries.
This method returns shp_id and cellid columns. The shp_id column contains the index of the geometry in the original input shape provided by the user. This is useful when the input is an array of shapely geometries. In this case we have only one polygon, so the shp_id is always equal to 0. For structured grids the row and column indices are returned in the row and col columns.
[12]:
gi.intersects(p, dataframe=True)
[12]:
| cellids | cellid | row | col | |
|---|---|---|---|---|
| shp_id | ||||
| 0 | (1, 3) | 13 | 1 | 3 |
| 0 | (2, 2) | 22 | 2 | 2 |
| 0 | (2, 3) | 23 | 2 | 3 |
| 0 | (2, 4) | 24 | 2 | 4 |
| 0 | (2, 5) | 25 | 2 | 5 |
| 0 | (3, 2) | 32 | 3 | 2 |
| 0 | (3, 3) | 33 | 3 | 3 |
| 0 | (3, 4) | 34 | 3 | 4 |
| 0 | (3, 5) | 35 | 3 | 5 |
| 0 | (3, 6) | 36 | 3 | 6 |
| 0 | (4, 1) | 41 | 4 | 1 |
| 0 | (4, 2) | 42 | 4 | 2 |
| 0 | (4, 3) | 43 | 4 | 3 |
| 0 | (4, 4) | 44 | 4 | 4 |
| 0 | (4, 5) | 45 | 4 | 5 |
| 0 | (4, 6) | 46 | 4 | 6 |
| 0 | (4, 7) | 47 | 4 | 7 |
| 0 | (4, 8) | 48 | 4 | 8 |
| 0 | (5, 1) | 51 | 5 | 1 |
| 0 | (5, 2) | 52 | 5 | 2 |
| 0 | (5, 3) | 53 | 5 | 3 |
| 0 | (5, 4) | 54 | 5 | 4 |
| 0 | (5, 5) | 55 | 5 | 5 |
| 0 | (5, 6) | 56 | 5 | 6 |
| 0 | (5, 7) | 57 | 5 | 7 |
| 0 | (5, 8) | 58 | 5 | 8 |
| 0 | (6, 1) | 61 | 6 | 1 |
| 0 | (6, 2) | 62 | 6 | 2 |
| 0 | (6, 4) | 64 | 6 | 4 |
| 0 | (6, 5) | 65 | 6 | 5 |
| 0 | (6, 6) | 66 | 6 | 6 |
| 0 | (6, 7) | 67 | 6 | 7 |
| 0 | (6, 8) | 68 | 6 | 8 |
| 0 | (7, 1) | 71 | 7 | 1 |
| 0 | (7, 2) | 72 | 7 | 2 |
| 0 | (7, 3) | 73 | 7 | 3 |
| 0 | (7, 4) | 74 | 7 | 4 |
| 0 | (7, 5) | 75 | 7 | 5 |
| 0 | (7, 6) | 76 | 7 | 6 |
| 0 | (8, 1) | 81 | 8 | 1 |
| 0 | (8, 2) | 82 | 8 | 2 |
| 0 | (8, 3) | 83 | 8 | 3 |
| 0 | (8, 4) | 84 | 8 | 4 |
| 0 | (8, 5) | 85 | 8 | 5 |
| 0 | (9, 2) | 92 | 9 | 2 |
| 0 | (9, 3) | 93 | 9 | 3 |
| 0 | (9, 4) | 94 | 9 | 4 |
The results of an intersection can be visualized with the GridIntersect.plot_intersection_result() method.
[13]:
# create a figure and plot the grid
fig, ax = plt.subplots(1, 1, figsize=(8, 8))

# the intersection object contains some helpful plotting commands
gi.plot_intersection_result(result, ax=ax)

# add black x at cell centers
for irow, icol in zip(result.row, result.col):
    (h2,) = ax.plot(
        sgr.xcellcenters[0, icol],
        sgr.ycellcenters[irow, 0],
        "kx",
        label="centroids of intersected gridcells",
    )

# add legend
ax.legend([h2], [i.get_label() for i in [h2]], loc="best")
[13]:
<matplotlib.legend.Legend at 0x7f01aeb4c2e0>

The intersect() method contains several keyword arguments that specifically deal with polygons:
contains_centroid: only store intersection result if cell centroid is contained within polygonmin_area_fraction: minimal intersecting cell area (expressed as a fraction of the total cell area) to include cells in intersection result
Two examples showing the usage of these keyword arguments are shown below.
Example with contains_centroid set to True, only cells in which centroid is within the intersected polygon are stored. Note the difference with the previous result.
[14]:
# contains_centroid example

result2 = gi.intersect(p, contains_centroid=True, geo_dataframe=True)

fig, ax = plt.subplots(1, 1, figsize=(8, 8))
gi.plot_intersection_result(result2, ax=ax)

# add black x at cell centers
for irow, icol in zip(result2.row, result2.col):
    (h2,) = ax.plot(
        sgr.xcellcenters[0, icol],
        sgr.ycellcenters[irow, 0],
        "kx",
        label="centroids of intersected gridcells",
    )

# add legend
ax.legend([h2], [i.get_label() for i in [h2]], loc="best")
[14]:
<matplotlib.legend.Legend at 0x7f01a6597820>

Example with min_area_threshold set to 0.35, the intersection result in a cell should cover 35% or more of the cell area.
[15]:
# min_area_threshold example

result3 = gi.intersect(p, min_area_fraction=0.35)

fig, ax = plt.subplots(1, 1, figsize=(8, 8))
gi.plot_intersection_result(result3, ax=ax)

# add black x at cell centers
for irow, icol in zip(result3.row, result3.col):
    (h2,) = ax.plot(
        sgr.xcellcenters[0, icol],
        sgr.ycellcenters[irow, 0],
        "kx",
        label="centroids of intersected gridcells",
    )
# add legend
ax.legend([h2], [i.get_label() for i in [h2]], loc="best")
/home/runner/work/flopy/flopy/modflow6/.pixi/envs/rtd/lib/python3.10/site-packages/flopy/utils/gridintersect.py:292: DeprecationWarning: In the future this function will return a GeoDataFrame by default. Set geo_dataframe=True to adopt future behavior and silence this warning. Set geo_dataframe=False to silence this warning and maintain old behavior
  warnings.warn(
[15]:
<matplotlib.legend.Legend at 0x7f01a6665750>
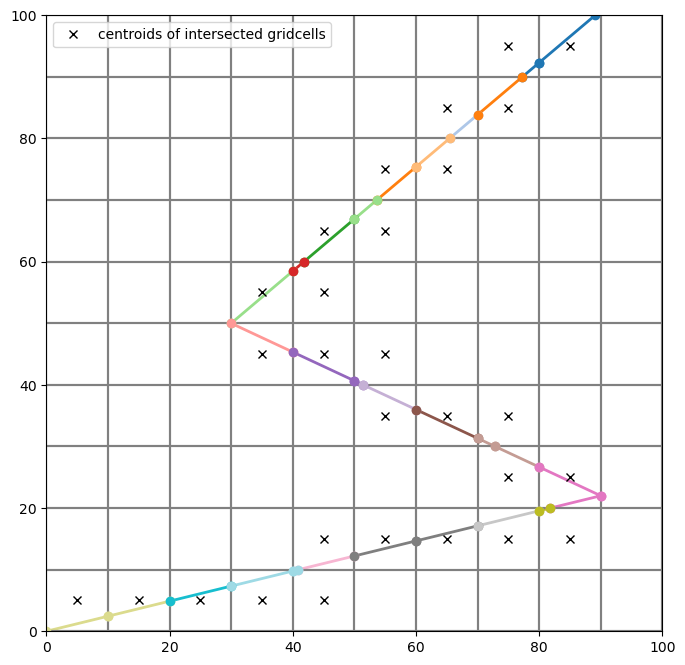
Polyline with regular grid
MultiLineString to intersect with:
[16]:
ls1 = LineString([(95, 105), (30, 50)])
ls2 = LineString([(30, 50), (90, 22)])
ls3 = LineString([(90, 22), (0, 0)])
mls = MultiLineString(lines=[ls1, ls2, ls3])
[17]:
result = gi.intersect(mls, geo_dataframe=True)
Plot the result
[18]:
fig, ax = plt.subplots(1, 1, figsize=(8, 8))
sgr.plot(ax=ax)
gi.plot_intersection_result(result, ax=ax, cmap="tab20")

for irow, icol in zip(result.row, result.col):
    (h2,) = ax.plot(
        sgr.xcellcenters[0, icol],
        sgr.ycellcenters[irow, 0],
        "kx",
        label="centroids of intersected gridcells",
    )

ax.legend([h2], [i.get_label() for i in [h2]], loc="best")
[18]:
<matplotlib.legend.Legend at 0x7f01a63684c0>
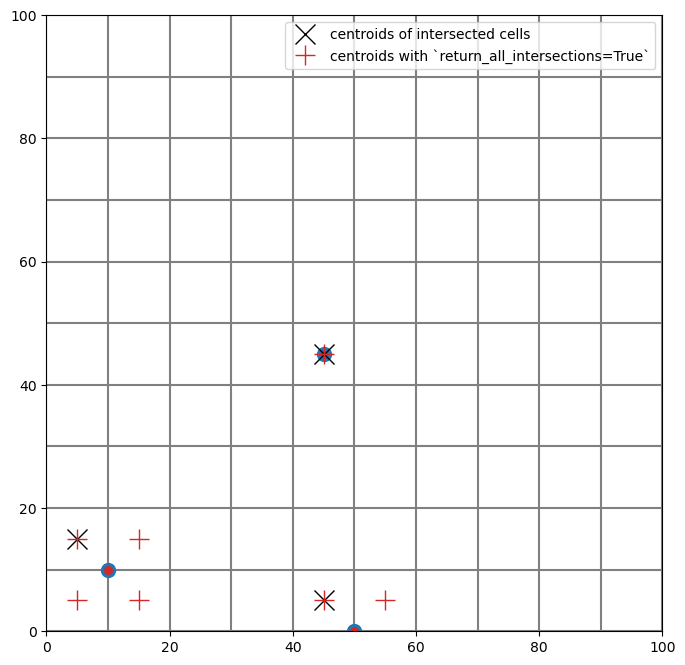
MultiPoint with regular grid
MultiPoint to intersect with
[19]:
mp = MultiPoint(
    points=[Point(50.0, 0.0), Point(45.0, 45.0), Point(10.0, 10.0), Point(150.0, 100.0)]
)
For points and linestrings there is a keyword argument return_all_intersections which will return multiple intersection results for points or (parts of) linestrings on cell boundaries. As an example, the difference is shown with the MultiPoint intersection. Note the number of red “+” symbols indicating the centroids of intersected cells, in the bottom left case, there are 4 results because the point lies exactly on the intersection between 4 grid cells.
[20]:
result = gi.intersect(mp, geo_dataframe=True)
result_all = gi.intersect(mp, return_all_intersections=True, geo_dataframe=True)
[21]:
fig, ax = plt.subplots(1, 1, figsize=(8, 8))
sgr.plot(ax=ax)
gi.plot_point(result.geometry, ax=ax, ms=10, color="C0")
gi.plot_point(result_all.geometry, ax=ax, ms=10, marker=".", color="C3")

for irow, icol in zip(result.row, result.col):
    (h2,) = ax.plot(
        sgr.xcellcenters[0, icol],
        sgr.ycellcenters[irow, 0],
        "kx",
        ms=15,
        label="centroids of intersected cells",
    )

for irow, icol in zip(result_all.row, result_all.col):
    (h3,) = ax.plot(
        sgr.xcellcenters[0, icol],
        sgr.ycellcenters[irow, 0],
        "C3+",
        ms=15,
        label="centroids with `return_all_intersections=True`",
    )

ax.legend([h2, h3], [i.get_label() for i in [h2, h3]], loc="best")
[21]:
<matplotlib.legend.Legend at 0x7f01a606a980>
In addition to the intersect() and intersects() methods there is function to quickly get the cellids for many points. This is done with points_to_cellids().
First lets create an array containing shapely Points.
[22]:
n_pts = 10
rng = np.random.default_rng(seed=42)
x_coords = rng.uniform(0, 100, n_pts)
y_coords = rng.uniform(0, 100, n_pts)
random_points = shapely.points(x_coords, y_coords)
Now find the cellid for each point. points_to_cellids will only return a single result for each point. In case a point is on the boundary between multiple cells, it will return the cell with the lowest cellid.
[23]:
result = gi.points_to_cellids(random_points)
result
[23]:
| cellids | cellid | row | col | |
|---|---|---|---|---|
| shp_id | ||||
| 0 | (6, 7) | 67 | 6 | 7 |
| 1 | (0, 4) | 4 | 0 | 4 |
| 2 | (3, 8) | 38 | 3 | 8 |
| 3 | (1, 6) | 16 | 1 | 6 |
| 4 | (5, 0) | 50 | 5 | 0 |
| 5 | (7, 9) | 79 | 7 | 9 |
| 6 | (4, 7) | 47 | 4 | 7 |
| 7 | (9, 7) | 97 | 9 | 7 |
| 8 | (1, 1) | 11 | 1 | 1 |
| 9 | (3, 4) | 34 | 3 | 4 |
Plot the result
[24]:
fig, ax = plt.subplots(1, 1, figsize=(8, 8))
sgr.plot(ax=ax)
ax.plot(x_coords, y_coords, "ro", ms=5, label="random points")
gi.plot_polygon(gi.geoms[result.cellid], ax=ax, fc="yellow", edgecolor="k", zorder=5)
[24]:
<Axes: >

Note that points_to_cellids() returns NA for points that lie outside the model grid.
[25]:
gi.points_to_cellids(shapely.points([50, 110], [55, 50]))
[25]:
| cellids | cellid | row | col | |
|---|---|---|---|---|
| shp_id | ||||
| 0 | (4, 4) | 44 | 4 | 4 |
| 1 | <NA> | <NA> | <NA> | <NA> |
Vertex Grid
[26]:
cell2d = [
    [0, 83.33333333333333, 66.66666666666667, 3, 4, 2, 7],
    [1, 16.666666666666668, 33.333333333333336, 3, 4, 0, 5],
    [2, 33.333333333333336, 83.33333333333333, 3, 1, 8, 4],
    [3, 16.666666666666668, 66.66666666666667, 3, 5, 1, 4],
    [4, 33.333333333333336, 16.666666666666668, 3, 6, 0, 4],
    [5, 66.66666666666667, 16.666666666666668, 3, 4, 3, 6],
    [6, 83.33333333333333, 33.333333333333336, 3, 7, 3, 4],
    [7, 66.66666666666667, 83.33333333333333, 3, 8, 2, 4],
]
vertices = [
    [0, 0.0, 0.0],
    [1, 0.0, 100.0],
    [2, 100.0, 100.0],
    [3, 100.0, 0.0],
    [4, 50.0, 50.0],
    [5, 0.0, 50.0],
    [6, 50.0, 0.0],
    [7, 100.0, 50.0],
    [8, 50.0, 100.0],
]
tgr = fgrid.VertexGrid(vertices, cell2d)
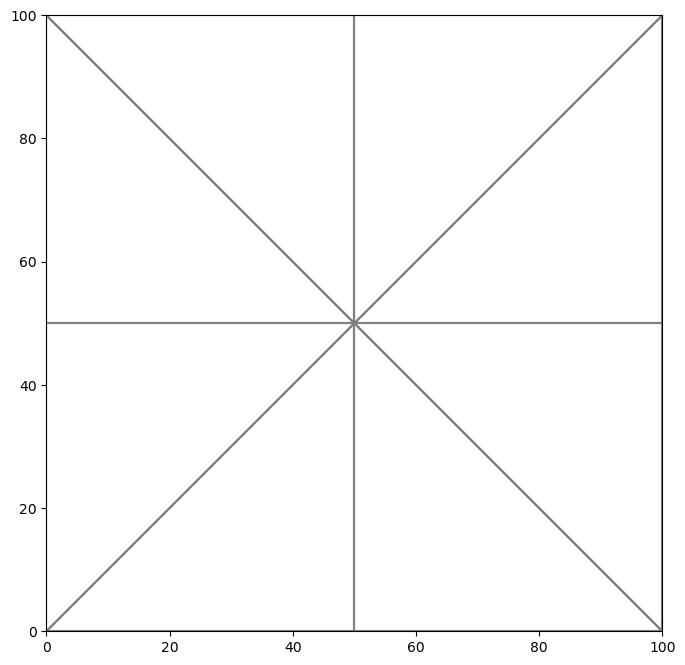
[27]:
fig, ax = plt.subplots(1, 1, figsize=(8, 8))
pmv = fplot.PlotMapView(modelgrid=tgr)
pmv.plot_grid(ax=ax)
[27]:
<matplotlib.collections.LineCollection at 0x7f01a5f8a200>
Polygon with triangular grid
[28]:
gi2 = GridIntersect(tgr)
[29]:
result = gi2.intersect(p, geo_dataframe=True)
[30]:
fig, ax = plt.subplots(1, 1, figsize=(8, 8))
gi2.plot_intersection_result(result, ax=ax)

# only cells that intersect with shape
for cellid in result.cellid:
    (h2,) = ax.plot(
        tgr.xcellcenters[cellid],
        tgr.ycellcenters[cellid],
        "kx",
        label="centroids of intersected gridcells",
    )

ax.legend([h2], [i.get_label() for i in [h2]], loc="best")
[30]:
<matplotlib.legend.Legend at 0x7f01a5f4fc40>

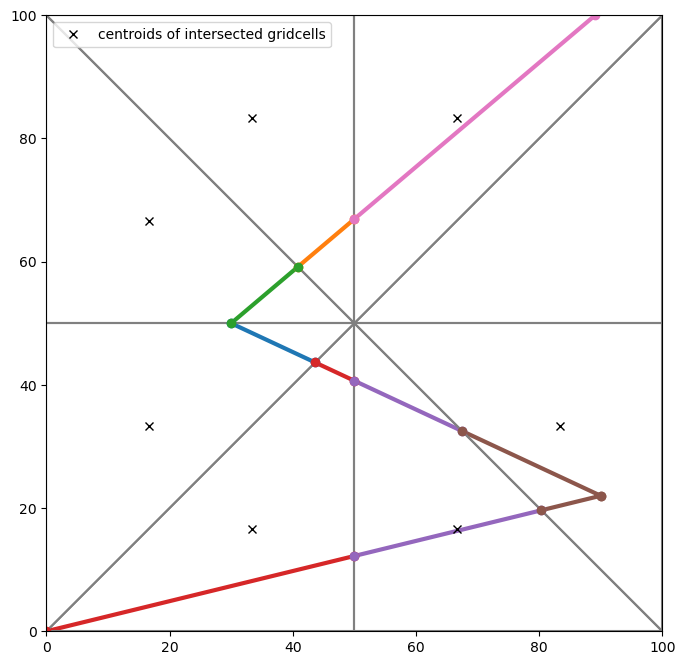
LineString with triangular grid
[31]:
result = gi2.intersect(mls, geo_dataframe=True)
[32]:
fig, ax = plt.subplots(1, 1, figsize=(8, 8))
gi2.plot_intersection_result(result, ax=ax, lw=3)

for cellid in result.cellid:
    (h2,) = ax.plot(
        tgr.xcellcenters[cellid],
        tgr.ycellcenters[cellid],
        "kx",
        label="centroids of intersected gridcells",
    )

ax.legend([h2], [i.get_label() for i in [h2]], loc="best")
[32]:
<matplotlib.legend.Legend at 0x7f01a5e92410>
MultiPoint with triangular grid
[33]:
result = gi2.intersect(mp, geo_dataframe=True)
result_all = gi2.intersect(mp, return_all_intersections=True, geo_dataframe=True)
[34]:
fig, ax = plt.subplots(1, 1, figsize=(8, 8))
gi2.plot_intersection_result(result, ax=ax, color="k", zorder=5, ms=10)

for cellid in result.cellid:
    (h2,) = ax.plot(
        tgr.xcellcenters[cellid],
        tgr.ycellcenters[cellid],
        "kx",
        ms=15,
        label="centroids of intersected cells",
    )
for cellid in result_all.cellid:
    (h3,) = ax.plot(
        tgr.xcellcenters[cellid],
        tgr.ycellcenters[cellid],
        "r+",
        ms=15,
        label="centroids with return_all_intersections=True",
    )

ax.legend([h2, h3], [i.get_label() for i in [h2, h3]], loc="best")
[34]:
<matplotlib.legend.Legend at 0x7f01a5d41030>

[ ]: