This page was generated from
save_binary_data_file_example.py.
It's also available as a notebook.
Saving array data to MODFLOW-style binary files
[1]:
import os
import shutil
import sys
from tempfile import TemporaryDirectory

import matplotlib as mpl
import matplotlib.pyplot as plt
import numpy as np

import flopy

print(sys.version)
print(f"numpy version: {np.__version__}")
print(f"matplotlib version: {mpl.__version__}")
print(f"flopy version: {flopy.__version__}")
3.10.18 | packaged by conda-forge | (main, Jun  4 2025, 14:45:41) [GCC 13.3.0]
numpy version: 2.2.6
matplotlib version: 3.10.6
flopy version: 3.11.0.dev0
[2]:
nlay, nrow, ncol = 1, 20, 10

# temporary directory
temp_dir = TemporaryDirectory()
model_ws = os.path.join(temp_dir.name, "binary_data")

if os.path.exists(model_ws):
    shutil.rmtree(model_ws)

precision = "single"  # or 'double'
dtype = np.float32  # or np.float64

mf = flopy.modflow.Modflow(model_ws=model_ws)
dis = flopy.modflow.ModflowDis(mf, nlay=nlay, nrow=nrow, ncol=ncol, delr=20, delc=10)
Create a linear data array
[3]:
# create the first row of data
b = np.linspace(10, 1, num=ncol, dtype=dtype).reshape(1, ncol)

# extend data to every row
b = np.repeat(b, nrow, axis=0)

# print the shape and type of the data
print(b.shape)
(20, 10)
Plot the data array
[4]:
pmv = flopy.plot.PlotMapView(model=mf)
v = pmv.plot_array(b)
pmv.plot_grid()
plt.colorbar(v, shrink=0.5)
[4]:
<matplotlib.colorbar.Colorbar at 0x7fd8ebfbb6a0>

Write the linear data array to a binary file
[5]:
text = "head"

# write a binary data file
pertim = dtype(1.0)
header = flopy.utils.BinaryHeader.create(
    bintype=text,
    precision=precision,
    text=text,
    nrow=nrow,
    ncol=ncol,
    ilay=1,
    pertim=pertim,
    totim=pertim,
    kstp=1,
    kper=1,
)
pth = os.path.join(model_ws, "bottom.bin")
flopy.utils.Util2d.write_bin(b.shape, pth, b, header_data=header)
Read the binary data file
[6]:
bo = flopy.utils.HeadFile(pth, precision=precision)
br = bo.get_data(idx=0)
Plot the data that was read from the binary file
[7]:
pmv = flopy.plot.PlotMapView(model=mf)
v = pmv.plot_array(br)
pmv.plot_grid()
plt.colorbar(v, shrink=0.5)
[7]:
<matplotlib.colorbar.Colorbar at 0x7fd8e3c59e40>

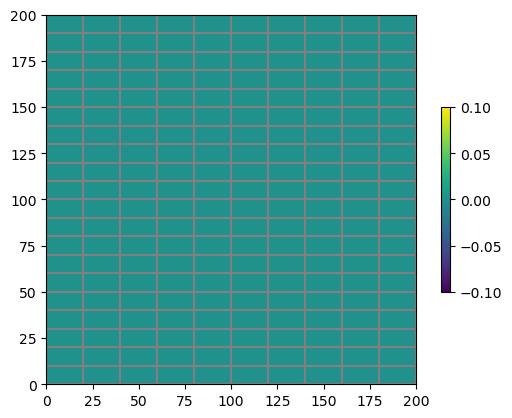
Plot the difference in the two values
[8]:
pmv = flopy.plot.PlotMapView(model=mf)
v = pmv.plot_array(b - br)
pmv.plot_grid()
plt.colorbar(v, shrink=0.5)
[8]:
<matplotlib.colorbar.Colorbar at 0x7fd8e3b0f730>
[9]:
try:
    # ignore PermissionError on Windows
    temp_dir.cleanup()
except:
    pass