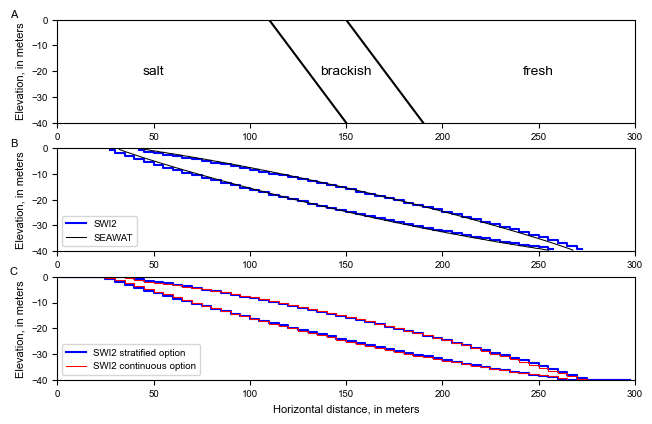
SWI2 Example 2. Rotating Brackish Zone
This example problem modifies the rotating interface problem, with 3 zones, no boundary inflow, impermeable aquifer top and bottoms, and ignoring storage changes. The problem domain is 300m long, 40m high, and 1m wide. The aquifer is confined. At x=0, there is a constant head of 0m.
The grid discretization has 60 columns, 1 row, and 1 layer, and delr of 5m, delc 1m, and 40m height. The time discretization is a single period with 1000 time steps, each of 2 days.
There are three groundwater zones: freshwater, brackish, and seawater. The zones are separated by two active ZETA surfaces representing the 25% and 75% seawater salinity contours. Fluid density is represented using the stratified option (ISTRAT=1). The maximum slope of the toe and tip is specified as 0.4, and default tip and toe parameters are used (ALPHA=BETA=0.1). At time t = 0, both interfaces are straight and oriented 45° from horizontal. Initial ZETA surfaces 1 and 2 extend from (x,z) = (150,0) to (x,z) = (190,-40), and from (x,z) = (110,0) to (x,z) = (150,-40), respectively. The brackish zone rotates toward a horizontal position over time.
Import dependencies.
[1]:
import os
import sys
from tempfile import TemporaryDirectory

import matplotlib as mpl
import matplotlib.pyplot as plt
import numpy as np

import flopy

print(sys.version)
print(f"numpy version: {np.__version__}")
print(f"matplotlib version: {mpl.__version__}")
print(f"flopy version: {flopy.__version__}")
3.10.18 | packaged by conda-forge | (main, Jun  4 2025, 14:45:41) [GCC 13.3.0]
numpy version: 2.2.6
matplotlib version: 3.10.6
flopy version: 3.11.0.dev0
[2]:
# Modify default matplotlib settings.
updates = {
    "font.family": ["Arial"],
    "mathtext.default": "regular",
    "pdf.compression": 0,
    "pdf.fonttype": 42,
    "legend.fontsize": 7,
    "axes.labelsize": 8,
    "xtick.labelsize": 7,
    "ytick.labelsize": 7,
}
plt.rcParams.update(updates)
Define model name and the location of the MODFLOW executable (assumed available on the path).
[3]:
modelname = "swiex2"
exe_name = "mf2005"
Create a temporary workspace.
[4]:
temp_dir = TemporaryDirectory()
workspace = temp_dir.name
Create nested working directories.
[5]:
dirs = [os.path.join(workspace, "SWI2"), os.path.join(workspace, "SEAWAT")]
for d in dirs:
    if not os.path.exists(d):
        os.mkdir(d)
Define model discretization information.
[6]:
nper = 1
perlen = 2000
nstp = 1000
nlay, nrow, ncol = 1, 1, 60
delr = 5.0
nsurf = 2
x = np.arange(0.5 * delr, ncol * delr, delr)
xedge = np.linspace(0, float(ncol) * delr, len(x) + 1)
ibound = np.ones((nrow, ncol), int)
ibound[0, 0] = -1
Define SWI2 data.
[7]:
z0 = np.zeros((nlay, nrow, ncol), float)
z1 = np.zeros((nlay, nrow, ncol), float)
z0[0, 0, 30:38] = np.arange(-2.5, -40, -5)
z0[0, 0, 38:] = -40
z1[0, 0, 22:30] = np.arange(-2.5, -40, -5)
z1[0, 0, 30:] = -40
z = []
z.append(z0)
z.append(z1)
ssz = 0.2
isource = np.ones((nrow, ncol), "int")
isource[0, 0] = 2
Create a stratified model and specify that it is a MODFLOW 2005 model.
[8]:
modelname = "swiex2_strat"
print("creating...", modelname)
ml = flopy.modflow.Modflow(
    modelname, version="mf2005", exe_name=exe_name, model_ws=dirs[0]
)
discret = flopy.modflow.ModflowDis(
    ml,
    nlay=1,
    ncol=ncol,
    nrow=nrow,
    delr=delr,
    delc=1,
    top=0,
    botm=[-40.0],
    nper=nper,
    perlen=perlen,
    nstp=nstp,
)
bas = flopy.modflow.ModflowBas(ml, ibound=ibound, strt=0.05)
bcf = flopy.modflow.ModflowBcf(ml, laycon=0, tran=2 * 40)
swi = flopy.modflow.ModflowSwi2(
    ml,
    iswizt=55,
    nsrf=nsurf,
    istrat=1,
    toeslope=0.2,
    tipslope=0.2,
    nu=[0, 0.0125, 0.025],
    zeta=z,
    ssz=ssz,
    isource=isource,
    nsolver=1,
)
oc = flopy.modflow.ModflowOc(ml, stress_period_data={(0, 999): ["save head"]})
pcg = flopy.modflow.ModflowPcg(ml)
creating... swiex2_strat
Write input files and run the stratified model.
[9]:
ml.write_input()
success, buff = ml.run_model(silent=True, report=True)
assert success, "Failed to run."
Load results from the stratified model.
[10]:
zetafile = os.path.join(dirs[0], f"{modelname}.zta")
zobj = flopy.utils.CellBudgetFile(zetafile)
zkstpkper = zobj.get_kstpkper()
zeta = zobj.get_data(kstpkper=zkstpkper[-1], text="ZETASRF  1")[0]
zeta2 = zobj.get_data(kstpkper=zkstpkper[-1], text="ZETASRF  2")[0]
Define VD model.
[11]:
modelname = "swiex2_vd"
print("creating...", modelname)
ml = flopy.modflow.Modflow(
    modelname, version="mf2005", exe_name=exe_name, model_ws=dirs[0]
)
discret = flopy.modflow.ModflowDis(
    ml,
    nlay=1,
    ncol=ncol,
    nrow=nrow,
    delr=delr,
    delc=1,
    top=0,
    botm=[-40.0],
    nper=nper,
    perlen=perlen,
    nstp=nstp,
)
bas = flopy.modflow.ModflowBas(ml, ibound=ibound, strt=0.05)
bcf = flopy.modflow.ModflowBcf(ml, laycon=0, tran=2 * 40)
swi = flopy.modflow.ModflowSwi2(
    ml,
    iswizt=55,
    nsrf=nsurf,
    istrat=0,
    toeslope=0.2,
    tipslope=0.2,
    nu=[0, 0, 0.025, 0.025],
    zeta=z,
    ssz=ssz,
    isource=isource,
    nsolver=1,
)
oc = flopy.modflow.ModflowOc(ml, stress_period_data={(0, 999): ["save head"]})
pcg = flopy.modflow.ModflowPcg(ml)
creating... swiex2_vd
Write input files and run VD model.
[12]:
ml.write_input()
success, buff = ml.run_model(silent=True, report=True)
assert success, "Failed to run."
Load VD model results.
[13]:
zetafile = os.path.join(dirs[0], f"{modelname}.zta")
zobj = flopy.utils.CellBudgetFile(zetafile)
zkstpkper = zobj.get_kstpkper()
zetavd = zobj.get_data(kstpkper=zkstpkper[-1], text="ZETASRF  1")[0]
zetavd2 = zobj.get_data(kstpkper=zkstpkper[-1], text="ZETASRF  2")[0]
Define SEAWAT model.
[14]:
swtexe_name = "swtv4"
modelname = "swiex2_swt"
print("creating...", modelname)
swt_xmax = 300.0
swt_zmax = 40.0
swt_delr = 1.0
swt_delc = 1.0
swt_delz = 0.5
swt_ncol = int(swt_xmax / swt_delr)  # 300
swt_nrow = 1
swt_nlay = int(swt_zmax / swt_delz)  # 80
print(swt_nlay, swt_nrow, swt_ncol)
swt_ibound = np.ones((swt_nlay, swt_nrow, swt_ncol), int)
# swt_ibound[0, swt_ncol-1, 0] = -1
swt_ibound[0, 0, 0] = -1
swt_x = np.arange(0.5 * swt_delr, swt_ncol * swt_delr, swt_delr)
swt_xedge = np.linspace(0, float(ncol) * delr, len(swt_x) + 1)
swt_top = 0.0
z0 = swt_top
swt_botm = np.zeros((swt_nlay), float)
swt_z = np.zeros((swt_nlay), float)
zcell = -swt_delz / 2.0
for ilay in range(0, swt_nlay):
    z0 -= swt_delz
    swt_botm[ilay] = z0
    swt_z[ilay] = zcell
    zcell -= swt_delz
# swt_X, swt_Z = np.meshgrid(swt_x, swt_botm)
swt_X, swt_Z = np.meshgrid(swt_x, swt_z)
# mt3d
# mt3d boundary array set to all active
icbund = np.ones((swt_nlay, swt_nrow, swt_ncol), int)
# create initial concentrations for MT3D
sconc = np.ones((swt_nlay, swt_nrow, swt_ncol), float)
sconcp = np.zeros((swt_nlay, swt_ncol), float)
xsb = 110
xbf = 150
for ilay in range(0, swt_nlay):
    for icol in range(0, swt_ncol):
        if swt_x[icol] > xsb:
            sconc[ilay, 0, icol] = 0.5
        if swt_x[icol] > xbf:
            sconc[ilay, 0, icol] = 0.0
    for icol in range(0, swt_ncol):
        sconcp[ilay, icol] = sconc[ilay, 0, icol]
    xsb += swt_delz
    xbf += swt_delz

# ssm data
itype = flopy.mt3d.Mt3dSsm.itype_dict()
ssm_data = {0: [0, 0, 0, 35.0, itype["BAS6"]]}

# print sconcp
# mt3d print times
timprs = (np.arange(5) + 1) * 2000.0
nprs = len(timprs)
# create the MODFLOW files
m = flopy.seawat.Seawat(modelname, exe_name=swtexe_name, model_ws=dirs[1])
discret = flopy.modflow.ModflowDis(
    m,
    nrow=swt_nrow,
    ncol=swt_ncol,
    nlay=swt_nlay,
    delr=swt_delr,
    delc=swt_delc,
    laycbd=0,
    top=swt_top,
    botm=swt_botm,
    nper=nper,
    perlen=perlen,
    nstp=1,
    steady=False,
)
bas = flopy.modflow.ModflowBas(m, ibound=swt_ibound, strt=0.05)
lpf = flopy.modflow.ModflowLpf(m, hk=2.0, vka=2.0, ss=0.0, sy=0.0, laytyp=0, layavg=0)
oc = flopy.modflow.ModflowOc(m, save_every=1, save_types=["save head"])
pcg = flopy.modflow.ModflowPcg(m)
# Create the MT3DMS model files
adv = flopy.mt3d.Mt3dAdv(
    m,
    mixelm=-1,  # -1 is TVD
    percel=0.05,
    nadvfd=0,
    # 0 or 1 is upstream; 2 is central in space
    # particle based methods
    nplane=4,
    mxpart=1e7,
    itrack=2,
    dceps=1e-4,
    npl=16,
    nph=16,
    npmin=8,
    npmax=256,
)
btn = flopy.mt3d.Mt3dBtn(
    m,
    icbund=1,
    prsity=ssz,
    sconc=sconc,
    ifmtcn=-1,
    chkmas=False,
    nprobs=10,
    nprmas=10,
    dt0=0.0,
    ttsmult=1.2,
    ttsmax=100.0,
    ncomp=1,
    nprs=nprs,
    timprs=timprs,
    mxstrn=1e8,
)
dsp = flopy.mt3d.Mt3dDsp(m, al=0.0, trpt=1.0, trpv=1.0, dmcoef=0.0)
gcg = flopy.mt3d.Mt3dGcg(m, mxiter=1, iter1=50, isolve=3, cclose=1e-6, iprgcg=5)
ssm = flopy.mt3d.Mt3dSsm(m, stress_period_data=ssm_data)
# Create the SEAWAT model files
vdf = flopy.seawat.SeawatVdf(
    m,
    nswtcpl=1,
    iwtable=0,
    densemin=0,
    densemax=0,
    denseref=1000.0,
    denseslp=25.0,
    firstdt=1.0e-03,
)
creating... swiex2_swt
80 1 300
Write input files and run SEAWAT model.
[15]:
m.write_input()
success, buff = m.run_model(silent=True, report=True)
assert success, "Failed to run."
Load SEAWAT model results.
[16]:
ucnfile = os.path.join(dirs[1], "MT3D001.UCN")
uobj = flopy.utils.UcnFile(ucnfile)
times = uobj.get_times()
print(times)
ukstpkper = uobj.get_kstpkper()
print(ukstpkper)
c = uobj.get_data(totim=times[-1])
conc = np.zeros((swt_nlay, swt_ncol), float)
for icol in range(0, swt_ncol):
    for ilay in range(0, swt_nlay):
        conc[ilay, icol] = c[ilay, 0, icol]
[np.float32(2000.0)]
[(np.int32(0), np.int32(0))]
Create plots.
[17]:
# figure
fwid = 7.0  # 6.50
fhgt = 4.5  # 6.75
flft = 0.125
frgt = 0.95
fbot = 0.125
ftop = 0.925

print("creating  cross-section figure...")
xsf, axes = plt.subplots(3, 1, figsize=(fwid, fhgt), facecolor="w")
xsf.subplots_adjust(
    wspace=0.25, hspace=0.25, left=flft, right=frgt, bottom=fbot, top=ftop
)
# plot initial conditions
ax = axes[0]
ax.text(-0.075, 1.05, "A", transform=ax.transAxes, va="center", ha="center", size="8")
# text(.975, .1, '(a)', transform = ax.transAxes, va = 'center', ha = 'center')
ax.plot([110, 150], [0, -40], "k")
ax.plot([150, 190], [0, -40], "k")
ax.set_xlim(0, 300)
ax.set_ylim(-40, 0)
ax.set_yticks(np.arange(-40, 1, 10))
ax.text(50, -20, "salt", va="center", ha="center")
ax.text(150, -20, "brackish", va="center", ha="center")
ax.text(250, -20, "fresh", va="center", ha="center")
ax.set_ylabel("Elevation, in meters")
# plot stratified swi2 and seawat results
ax = axes[1]
ax.text(-0.075, 1.05, "B", transform=ax.transAxes, va="center", ha="center", size="8")

zp = zeta[0, 0, :]
p = (zp < 0.0) & (zp > -40.0)
ax.plot(x[p], zp[p], "b", linewidth=1.5, drawstyle="steps-mid")
zp = zeta2[0, 0, :]
p = (zp < 0.0) & (zp > -40.0)
ax.plot(x[p], zp[p], "b", linewidth=1.5, drawstyle="steps-mid")
# seawat data
cc = ax.contour(
    swt_X,
    swt_Z,
    conc,
    levels=[0.25, 0.75],
    colors="k",
    linestyles="solid",
    linewidths=0.75,
    zorder=101,
)
# fake figures
ax.plot([-100.0, -100], [-100.0, -100], "b", linewidth=1.5, label="SWI2")
ax.plot([-100.0, -100], [-100.0, -100], "k", linewidth=0.75, label="SEAWAT")
# legend
leg = ax.legend(loc="lower left", numpoints=1)
leg._drawFrame = False
# axes
ax.set_xlim(0, 300)
ax.set_ylim(-40, 0)
ax.set_yticks(np.arange(-40, 1, 10))
ax.set_ylabel("Elevation, in meters")
# plot vd model
ax = axes[2]
ax.text(-0.075, 1.05, "C", transform=ax.transAxes, va="center", ha="center", size="8")
dr = zeta[0, 0, :]
ax.plot(x, dr, "b", linewidth=1.5, drawstyle="steps-mid")
dr = zeta2[0, 0, :]
ax.plot(x, dr, "b", linewidth=1.5, drawstyle="steps-mid")
dr = zetavd[0, 0, :]
ax.plot(x, dr, "r", linewidth=0.75, drawstyle="steps-mid")
dr = zetavd2[0, 0, :]
ax.plot(x, dr, "r", linewidth=0.75, drawstyle="steps-mid")
# fake figures
ax.plot(
    [-100.0, -100], [-100.0, -100], "b", linewidth=1.5, label="SWI2 stratified option"
)
ax.plot(
    [-100.0, -100], [-100.0, -100], "r", linewidth=0.75, label="SWI2 continuous option"
)
# legend
leg = ax.legend(loc="lower left", numpoints=1)
leg._drawFrame = False
# axes
ax.set_xlim(0, 300)
ax.set_ylim(-40, 0)
ax.set_yticks(np.arange(-40, 1, 10))
ax.set_xlabel("Horizontal distance, in meters")
ax.set_ylabel("Elevation, in meters")
creating cross-section figure...
[17]:
Text(0, 0.5, 'Elevation, in meters')
Clean up the temporary workspace.
[18]:
try:
    # ignore PermissionError on Windows
    temp_dir.cleanup()
except:
    pass